
What is Predictive Analytics: Unlocking the Future with Data
What is predictive analytics? It’s a powerful tool that uses data to predict future outcomes. Unlike traditional analytics, which focuses on understanding past events, predictive analytics aims to anticipate what might happen next. By leveraging statistical models and machine learning algorithms, it helps businesses make informed decisions, optimize processes, and gain a competitive edge.
From forecasting sales trends to identifying potential risks, predictive analytics is transforming industries across the board. It’s used in finance to detect fraud, in healthcare to predict patient outcomes, in marketing to personalize customer experiences, and in countless other applications.
Introduction to Predictive Analytics: What Is Predictive Analytics
Predictive analytics is a type of data analysis that uses statistical techniques and machine learning algorithms to predict future outcomes. It’s about extracting insights from historical data to anticipate what might happen in the future, helping businesses make better decisions and achieve their goals.Predictive analytics is not just about making predictions; it’s about understanding the underlying factors driving those predictions.
This understanding allows businesses to proactively take actions to influence the future, instead of reacting to events after they happen.
Difference between Predictive Analytics and Traditional Analytics
Traditional analytics focuses on understanding past events and identifying trends. It uses descriptive statistics and data visualization to provide insights into what has happened. Predictive analytics, on the other hand, goes beyond simply describing the past. It uses statistical models and machine learning algorithms to predict future outcomes based on historical data.For example, traditional analytics might tell you that sales have been increasing steadily over the past year.
Predictive analytics could go further and predict future sales based on factors like seasonal trends, marketing campaigns, and economic indicators.
Predictive analytics is all about using data to forecast future trends. It’s like looking at the weather patterns and predicting a sunny day, but instead of rain clouds, we’re looking at customer behavior or market trends. For example, if you’re planning a pumpkin spice sugar scrub DIY project, predictive analytics could help you determine the best time to launch your product based on past sales data and seasonal trends.
It’s a powerful tool for making informed decisions, whether you’re launching a new product or simply planning your next DIY project.
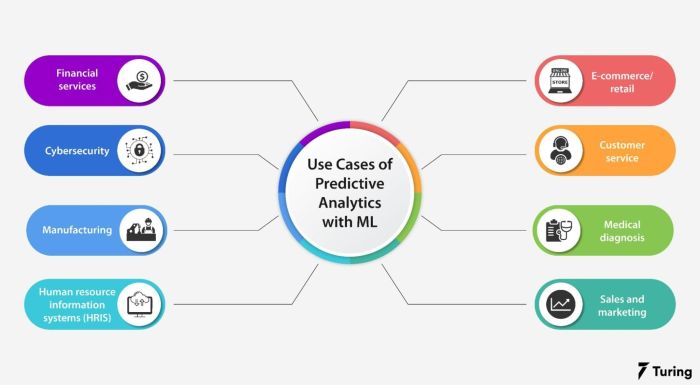
Applications of Predictive Analytics in Various Industries
Predictive analytics has a wide range of applications across various industries. Here are a few examples:
Retail
- Predicting customer demand:Retailers can use predictive analytics to forecast product demand based on historical sales data, seasonality, and other factors. This helps them optimize inventory levels, reduce stockouts, and avoid overstocking.
- Personalizing customer experiences:Predictive analytics can help retailers understand customer preferences and behaviors, enabling them to personalize product recommendations, marketing campaigns, and promotions. This can lead to increased customer satisfaction and loyalty.
- Identifying fraudulent transactions:Retailers can use predictive analytics to detect fraudulent transactions in real-time, reducing losses and protecting their customers.
Finance
- Assessing credit risk:Banks and other financial institutions use predictive analytics to assess the creditworthiness of borrowers, helping them make informed lending decisions and minimize the risk of loan defaults.
- Detecting fraudulent activities:Financial institutions can use predictive analytics to identify fraudulent transactions and activities, protecting their customers and their assets.
- Predicting market trends:Predictive analytics can help financial institutions understand market trends and make investment decisions based on data-driven insights.
Healthcare
- Predicting patient readmissions:Hospitals and healthcare providers can use predictive analytics to identify patients at risk of readmission, allowing them to intervene early and prevent unnecessary hospital stays.
- Diagnosing diseases:Predictive analytics can be used to develop diagnostic tools that help doctors identify diseases earlier and more accurately.
- Personalizing treatment plans:Predictive analytics can help healthcare providers personalize treatment plans based on individual patient characteristics and medical history.
Manufacturing
- Predictive maintenance:Manufacturers can use predictive analytics to predict equipment failures and schedule maintenance proactively, reducing downtime and improving operational efficiency.
- Optimizing production processes:Predictive analytics can help manufacturers optimize production processes by identifying bottlenecks and inefficiencies, leading to increased productivity and reduced costs.
- Improving supply chain management:Predictive analytics can help manufacturers forecast demand, optimize inventory levels, and improve the efficiency of their supply chains.
Key Components of Predictive Analytics
Predictive analytics relies heavily on data to make predictions and insights. Data serves as the foundation for building models and uncovering patterns that can inform future decisions.
Predictive analytics is all about using data to predict future outcomes. It’s like having a crystal ball, but instead of tea leaves, we use algorithms and statistics. We recently applied this to abeautifulmessxetsy the sellers we worked with , analyzing their sales data to predict future trends and identify opportunities for growth.
Predictive analytics is a powerful tool for businesses of all sizes, helping them make informed decisions and stay ahead of the curve.
Data in Predictive Analytics
Data is the lifeblood of predictive analytics. The quality and quantity of data directly influence the accuracy and reliability of predictions. Data can be categorized into different types, each with its own characteristics and applications in predictive analytics.
Types of Data Used in Predictive Analytics
- Structured Data:This type of data is organized in a predefined format, typically stored in relational databases. Examples include customer demographics, transaction history, and product information. Structured data is easily analyzed and processed, making it suitable for traditional statistical modeling techniques.
- Unstructured Data:Unlike structured data, unstructured data lacks a predefined format. It includes text documents, images, videos, audio recordings, and social media posts. Extracting meaningful insights from unstructured data requires advanced techniques such as natural language processing (NLP) and machine learning.
- Semi-structured Data:This type of data falls somewhere between structured and unstructured data. It has some organizational elements but doesn’t adhere to a rigid schema. Examples include JSON and XML files, which contain tags and attributes for organizing data.
Data Quality and Preprocessing
Data quality plays a crucial role in predictive analytics. Inaccurate or incomplete data can lead to biased models and unreliable predictions.
- Data Cleaning:This involves identifying and correcting errors, inconsistencies, and missing values in the data. Techniques like outlier detection, imputation, and data transformation are used to clean the data and ensure its accuracy.
- Data Transformation:This involves converting data into a suitable format for analysis. For example, categorical variables may need to be encoded into numerical values before being used in a predictive model.
- Feature Engineering:This involves creating new features from existing data to improve model performance. Feature engineering can help capture complex relationships between variables and enhance the predictive power of models.
Techniques Used in Predictive Analytics
Predictive analytics leverages a wide range of statistical and machine learning techniques to analyze historical data and make predictions about future events. These techniques are crucial for identifying patterns, trends, and relationships within data, enabling organizations to make informed decisions and optimize their operations.
Regression Analysis
Regression analysis is a statistical technique used to model the relationship between a dependent variable and one or more independent variables. It aims to understand how the dependent variable changes as the independent variables change. This technique is commonly used for predicting continuous outcomes, such as sales revenue, stock prices, or customer churn.There are various types of regression analysis, including:
- Linear Regression:Assumes a linear relationship between the dependent and independent variables. It aims to find the best-fitting line that minimizes the difference between the predicted and actual values. For example, a company might use linear regression to predict sales based on advertising expenditure.
- Logistic Regression:Used for predicting binary outcomes, such as whether a customer will purchase a product or not. It estimates the probability of an event occurring based on the independent variables. For instance, a bank might use logistic regression to assess the likelihood of loan defaults.
- Polynomial Regression:Extends linear regression to model non-linear relationships between variables by including polynomial terms. This technique can be used to predict more complex patterns in data, such as the relationship between temperature and the number of ice cream cones sold.
Regression Equation:The general form of a regression equation is: Y = β 0+ β 1X 1+ β 2X 2+ … + β nX n+ εwhere:
- Y is the dependent variable
- β 0is the intercept
- β 1, β 2, …, β nare the regression coefficients
- X 1, X 2, …, X nare the independent variables
- ε is the error term
Classification Algorithms
Classification algorithms are used to categorize data points into predefined classes or categories. They are particularly useful for predicting discrete outcomes, such as customer segmentation, fraud detection, or disease diagnosis. Some common classification algorithms include:
- Decision Trees:A tree-like structure where each node represents a decision based on a specific feature. They are easy to understand and interpret, but can be prone to overfitting. For example, a decision tree could be used to predict whether a customer is likely to purchase a product based on their age, income, and browsing history.
- Support Vector Machines (SVMs):Finds the optimal hyperplane that separates data points into different classes with the maximum margin. SVMs are powerful for high-dimensional data and can handle complex relationships between variables. For example, an SVM could be used to classify emails as spam or not spam based on their content and sender information.
- Naive Bayes:Based on Bayes’ theorem, it calculates the probability of an event occurring based on prior probabilities and observed evidence. It is a simple and efficient algorithm, often used for text classification. For example, a Naive Bayes classifier could be used to categorize news articles based on their topic.
- K-Nearest Neighbors (KNN):Classifies a data point based on the majority class of its k nearest neighbors. KNN is a non-parametric algorithm, meaning it does not make assumptions about the data distribution. For example, KNN could be used to predict whether a customer is likely to purchase a product based on their similarity to other customers who have made similar purchases.
Time Series Forecasting
Time series forecasting deals with predicting future values of a variable based on its historical values. It is commonly used in areas like financial forecasting, demand planning, and weather prediction.
- Moving Average:Calculates the average of a series of data points over a specific time period. It smooths out short-term fluctuations and helps identify long-term trends. For example, a moving average could be used to forecast monthly sales based on the average sales over the past three months.
- Exponential Smoothing:Assigns exponentially decreasing weights to past data points, giving more weight to recent observations. This technique is useful for capturing trends and seasonality in time series data. For example, exponential smoothing could be used to forecast daily demand for a product based on past demand patterns.
- Autoregressive Integrated Moving Average (ARIMA):A statistical model that uses past values of a time series to predict future values. ARIMA models are powerful for capturing complex patterns in time series data, including seasonality and trend. For example, an ARIMA model could be used to forecast the price of a commodity based on its historical price fluctuations.
Clustering
Clustering techniques group data points into clusters based on their similarity. They are used for customer segmentation, anomaly detection, and image segmentation.
- K-Means Clustering:An iterative algorithm that partitions data points into k clusters, where k is a predefined number. The algorithm aims to minimize the distance between data points within the same cluster and maximize the distance between clusters. For example, K-Means clustering could be used to segment customers into different groups based on their purchasing behavior.
- Hierarchical Clustering:Creates a hierarchy of clusters by iteratively merging or splitting clusters based on their similarity. It is useful for exploring the relationships between data points and identifying natural groupings. For example, hierarchical clustering could be used to identify different types of documents based on their content.
- DBSCAN (Density-Based Spatial Clustering of Applications with Noise):Identifies clusters based on the density of data points. It is effective for finding clusters of varying shapes and sizes, including clusters with outliers. For example, DBSCAN could be used to detect anomalies in network traffic patterns.
Building Predictive Models

Predictive models are the heart of predictive analytics, enabling us to make informed forecasts and decisions based on historical data. Building these models involves a systematic process that encompasses data preparation, model selection, training, and evaluation.
Data Preparation
The first step in building a predictive model is preparing the data. This involves cleaning, transforming, and organizing the data to ensure it is suitable for model training.
- Data Cleaning:This step involves identifying and removing inconsistencies, errors, or missing values in the data. This could include handling outliers, correcting typos, or imputing missing values using appropriate techniques.
- Data Transformation:Data transformation involves converting data into a format that is more suitable for model training. This might involve scaling numerical variables, encoding categorical variables, or creating new features by combining existing ones.
- Data Organization:Organizing the data involves structuring it into a format that can be easily understood by the chosen model. This might involve creating training and testing datasets, or splitting the data into features and target variables.
Model Selection
Once the data is prepared, the next step is to select a suitable predictive model. The choice of model depends on the type of data, the desired outcome, and the complexity of the problem.
Predictive analytics is all about using data to anticipate future trends. It’s like looking into a crystal ball, but instead of magic, it’s powered by algorithms and statistics. For example, if you’re looking for a new wardrobe, predictive analytics can help you find the best deals, like the Ralph Lauren Memorial Day sale with huge discounts on stylish apparel.
By analyzing past sales data, retailers can predict what items will be most popular and offer targeted promotions. So, the next time you’re shopping, remember that predictive analytics is working behind the scenes to make your experience smoother and more rewarding.
- Linear Regression:This model is suitable for predicting continuous variables, such as sales or prices, when there is a linear relationship between the independent and dependent variables.
- Logistic Regression:This model is used for predicting binary outcomes, such as whether a customer will churn or not, by estimating the probability of the outcome based on the input variables.
- Decision Trees:This model is a tree-like structure that uses a series of decision rules to predict the outcome. They are particularly useful for understanding the relationships between variables and can be easily interpreted.
- Support Vector Machines (SVMs):This model is effective for classifying data into different categories. They are known for their ability to handle complex data patterns and high-dimensional data.
- Neural Networks:These models are inspired by the human brain and can learn complex relationships from data. They are often used for tasks such as image recognition and natural language processing.
Model Training
Model training involves feeding the prepared data to the chosen model and allowing it to learn the relationships between the input variables and the target variable. The model uses this information to adjust its parameters and improve its predictive accuracy.
Model Evaluation, What is predictive analytics
Once the model is trained, it is important to evaluate its performance using a separate dataset that was not used during training. This helps to ensure that the model is not overfitting to the training data and can generalize well to new data.
- Accuracy:This metric measures the percentage of correct predictions made by the model.
- Precision:This metric measures the proportion of positive predictions that are actually correct.
- Recall:This metric measures the proportion of actual positive cases that are correctly identified by the model.
- F1-Score:This metric combines precision and recall into a single score.
- ROC Curve:This curve plots the true positive rate against the false positive rate for different threshold values, providing a visual representation of the model’s performance.
Model Validation and Testing
Model validation is crucial to ensure that the model is reliable and generalizable. This involves testing the model on unseen data and comparing its performance to the expected results.
- Cross-Validation:This technique involves splitting the data into multiple folds and training the model on different combinations of folds, using the remaining fold for testing. This helps to assess the model’s performance on different subsets of the data and reduces the risk of overfitting.
- A/B Testing:This method involves comparing the performance of two or more models on a controlled group of data. This helps to identify the model that performs best in a specific context.
Interpreting and Communicating Model Results
After evaluating the model, it is important to interpret the results and communicate them effectively to stakeholders. This involves explaining the model’s strengths and limitations, highlighting the key insights derived from the data, and presenting the findings in a clear and concise manner.
“The goal of predictive analytics is not just to predict the future, but to understand the underlying drivers of change and use this knowledge to make better decisions.”
Applications of Predictive Analytics
Predictive analytics has become a powerful tool across various industries, transforming how organizations make decisions and achieve their goals. By leveraging historical data and statistical models, predictive analytics can identify patterns, anticipate future trends, and provide insights that drive better outcomes.
Real-World Applications
Predictive analytics has a wide range of applications in various domains, enabling organizations to optimize their operations, enhance customer experiences, and gain a competitive advantage.
| Domain | Application | Example |
|---|---|---|
| Finance | Fraud Detection | Banks use predictive models to analyze transaction data and identify suspicious activities, reducing financial losses. |
| Healthcare | Disease Prediction | Hospitals utilize predictive analytics to identify patients at risk of developing certain diseases, enabling early intervention and better treatment outcomes. |
| Marketing | Customer Segmentation | Companies use predictive models to segment their customer base based on purchasing behavior, demographics, and other factors, enabling targeted marketing campaigns. |
| Retail | Inventory Management | Retailers leverage predictive analytics to forecast demand for specific products, optimizing inventory levels and reducing stockouts or excess inventory. |
| Manufacturing | Predictive Maintenance | Manufacturing companies use predictive models to analyze machine sensor data and predict potential equipment failures, enabling proactive maintenance and minimizing downtime. |
Case Studies
Several successful case studies showcase the benefits of using predictive analytics. * Netflix:The streaming giant utilizes predictive analytics to recommend movies and TV shows to its users, personalizing their viewing experience and increasing engagement. By analyzing user viewing history and preferences, Netflix’s recommendation engine suggests content that aligns with individual tastes, driving higher satisfaction and retention rates.
Amazon
The e-commerce giant uses predictive analytics to optimize its supply chain and inventory management. By analyzing historical sales data, customer demand patterns, and other factors, Amazon can forecast product demand and ensure timely delivery of goods. This enables them to minimize inventory costs, avoid stockouts, and deliver a seamless customer experience.
Target
The retail giant employs predictive analytics to identify pregnant women among its customers, enabling targeted marketing campaigns for baby products. By analyzing purchase patterns and other data, Target can predict which customers are likely to be pregnant and tailor their marketing messages accordingly.
This personalized approach has been highly effective in driving sales and customer loyalty.
Potential Use Cases
Predictive analytics offers numerous potential use cases across various industries.* Insurance:Predicting insurance claims, identifying fraudulent claims, and personalizing insurance premiums.
Education
Identifying students at risk of dropping out, predicting academic performance, and personalizing learning experiences.
Energy
Optimizing energy consumption, forecasting energy demand, and identifying potential power outages.
Transportation
Optimizing traffic flow, predicting delays, and improving public transportation efficiency.
Cybersecurity
Detecting cyber threats, predicting security breaches, and improving threat response.
Challenges and Considerations
While predictive analytics offers immense potential, implementing it effectively comes with its share of challenges and ethical considerations. These factors are crucial to acknowledge and address for successful and responsible deployment.
Data Quality and Availability
The accuracy and reliability of predictive models heavily depend on the quality and availability of data. Insufficient, incomplete, or inaccurate data can lead to biased or unreliable predictions.
- Data Noise and Outliers:Data often contains noise and outliers that can distort analysis and model performance. Identifying and handling these anomalies is crucial. For example, a dataset containing incorrect or missing values for customer demographics can significantly impact a model predicting customer churn.
- Data Integration:Combining data from various sources can be challenging, requiring careful data cleansing, transformation, and validation. This process ensures data consistency and compatibility for effective analysis. For instance, merging data from customer relationship management (CRM) systems and sales records can provide a comprehensive view for customer segmentation and targeted marketing.
- Data Privacy and Security:Protecting sensitive data is paramount. Implementing robust security measures and adhering to data privacy regulations is essential to safeguard customer information and maintain trust. For example, anonymizing customer data or using differential privacy techniques can help protect individual identities while still enabling valuable insights.
Model Bias and Fairness
Predictive models can inherit biases present in the training data, leading to unfair or discriminatory outcomes. Addressing bias is crucial to ensure ethical and responsible model deployment.
- Unconscious Bias:Human biases can unintentionally influence data collection, feature selection, and model development. It’s important to be aware of these biases and implement strategies to mitigate them. For example, using diverse teams for model development and testing can help identify and address potential biases.
- Fairness Metrics:Evaluating model fairness using metrics like equal opportunity, disparate impact, and calibration is essential to assess and improve model performance across different demographic groups. For instance, a loan approval model should be evaluated for fairness across different credit score ranges to ensure equal opportunities for all applicants.
- Transparency and Explainability:Understanding the reasoning behind model predictions is crucial for building trust and ensuring accountability. Techniques like feature importance analysis and decision trees can help explain model behavior and identify potential biases. For example, a model predicting customer churn can be analyzed to understand the key factors influencing churn and identify any discriminatory patterns.
Model Maintenance and Monitoring
Predictive models are not static entities and require ongoing maintenance and monitoring to ensure their effectiveness and relevance over time.
- Model Drift:As data patterns change, model performance can degrade. Regularly monitoring model performance and retraining with updated data are essential to address model drift. For instance, a model predicting product demand might require retraining as customer preferences evolve or new products are introduced.
- Continuous Improvement:Identifying areas for improvement and incorporating new data and insights can enhance model accuracy and predictive power. This iterative process ensures that models remain relevant and effective in a dynamic environment. For example, a model predicting customer lifetime value can be improved by incorporating feedback from customer surveys or new data on customer engagement patterns.