Microsoft Power BI Calculated Columns: Boost Your Data Analysis
Microsoft Power BI Calculated Columns are powerful tools that let you add custom calculations to your data, creating new insights and enhancing your analysis. These columns allow you to transform raw data into meaningful metrics, enabling you to understand your data in entirely new ways.
Calculated columns are a core feature of Power BI, allowing you to create dynamic data based on existing data in your tables. You can perform calculations like addition, subtraction, multiplication, and division, as well as use conditional statements and functions to manipulate dates, times, and text.
The possibilities are vast, allowing you to tailor your data to fit your specific analysis needs.
Understanding Calculated Columns
Calculated columns in Power BI are powerful tools that allow you to create new columns based on existing data in your dataset. They are essential for enhancing data analysis and creating meaningful insights.
Purpose of Calculated Columns
Calculated columns extend the capabilities of your data model by adding new information derived from existing columns. This allows you to perform calculations, transformations, and manipulations directly within the data table.
Benefits of Using Calculated Columns
- Enhanced Data Analysis: Calculated columns enable you to create new variables and metrics that are not directly available in your source data, expanding the scope of your analysis.
- Increased Flexibility: They provide a flexible way to modify and adapt your data to specific analytical needs without altering the original data source.
- Improved Data Quality: You can use calculated columns to clean, transform, and standardize data, ensuring consistency and accuracy across your dataset.
- Data Visualization: Calculated columns play a crucial role in creating dynamic visualizations that showcase derived metrics and trends, making data insights more accessible and engaging.
Common Use Cases for Calculated Columns
- Creating New Metrics: You can calculate derived metrics such as profit margins, customer lifetime value, or sales growth rates.
- Data Transformations: Calculated columns allow you to manipulate existing data, such as converting text to numbers, standardizing date formats, or combining multiple columns into a single value.
- Conditional Logic: Use calculated columns to apply logical conditions and create new columns based on specific criteria, such as flagging high-value customers or identifying outliers.
- Categorization and Grouping: Calculated columns can be used to categorize data based on specific criteria, such as grouping customers by region, age, or purchase history.
Best Practices for Creating and Using Calculated Columns
- Clear Naming Conventions: Use descriptive names that clearly indicate the purpose and content of the calculated column.
- Efficient Formulas: Optimize your formulas for performance, avoiding unnecessary calculations or complex expressions.
- Data Type Compatibility: Ensure that the data types of the columns used in your formulas are compatible to avoid errors.
- Test Thoroughly: Validate your calculated columns with sample data and real-world scenarios to ensure accuracy and reliability.
- Documentation: Document your calculated columns, including their purpose, formulas, and any assumptions or limitations.
Syntax and Structure
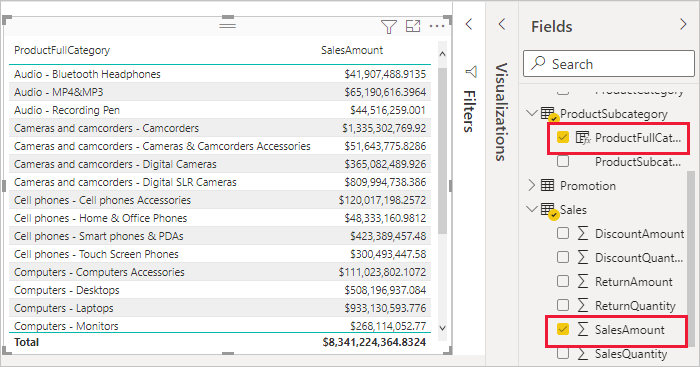
Power BI calculated columns are expressions that allow you to create new columns based on existing data in your dataset. These columns can be used to perform calculations, derive new information, or categorize data. Understanding the syntax and structure of calculated columns is crucial for leveraging their power effectively.
Syntax
The syntax for creating a calculated column in Power BI is as follows:
NewColumnName= Expression
* NewColumnName:The name of the new calculated column you are creating.
Expression
The formula or calculation that defines the value of the new column.
Referencing Existing Columns and Data Types
Calculated columns can reference existing columns in your dataset, allowing you to perform operations on their data. When referencing existing columns, you need to ensure that the data types are compatible with the operations you are performing.
Example
Let’s assume you have a table with two columns: “Sales” (numeric) and “Discount” (percentage). You want to create a new calculated column called “Discounted Sales” that calculates the sales amount after applying the discount.
Discounted Sales= Sales
- (1
- Discount)
In this example, the expression multiplies the “Sales” value by (1″Discount”) to calculate the discounted sales amount. The data types of “Sales” and “Discount” are compatible with the multiplication operation.
Microsoft Power BI calculated columns are incredibly powerful for data analysis, allowing you to create new columns based on existing data. For example, you could use a calculated column to analyze the impact of recent events, like the kaser focus lay off , on a company’s financial performance.
By adding a calculated column to track changes in revenue or expenses, you can gain valuable insights into the broader economic impact of such events.
Common Power BI Functions
Power BI provides a wide range of functions that can be used within calculated columns to perform various operations. Here is a table of common Power BI functions used in calculated columns:
| Function | Description | Example |
|---|---|---|
| SUM | Calculates the sum of values in a column. | SUM(Sales) |
| AVERAGE | Calculates the average of values in a column. | AVERAGE(Sales) |
| MAX | Returns the maximum value in a column. | MAX(Sales) |
| MIN | Returns the minimum value in a column. | MIN(Sales) |
| IF | Performs a conditional check and returns a value based on the condition. | IF(Sales > 1000, “High”, “Low”) |
| SWITCH | Evaluates a value against multiple conditions and returns a corresponding value. | SWITCH(Region, “North”, “Northern Region”, “South”, “Southern Region”, “West”, “Western Region”) |
Common Data Types
Understanding data types is crucial for creating accurate calculated columns. Power BI supports various data types, each with its specific characteristics and limitations. Here is a table of common data types used in calculated columns:
| Data Type | Description | Example |
|---|---|---|
| Number | Represents numeric values. | 100, 3.14,
Sometimes, when I’m working with data in Microsoft Power BI, I find myself needing to create a calculated column to derive new insights. It’s like adding a secret ingredient to a recipe, like the vibrant burst of flavor you get from the fresh peas and pesto in these peas pesto quinoa patties. Once you’ve added that calculated column, you can unlock a whole new level of analysis and visualization, just like those patties bring a delightful twist to your meal.
|
| Text | Represents textual data. | “Product A”, “Customer Name” |
| Date | Represents dates. | 2023-10-26 |
| DateTime | Represents dates and times. | 2023-10-26 10:00:00 |
| Boolean | Represents true or false values. | TRUE, FALSE |
Data Manipulation Techniques: Microsoft Power Bi Calculated Column
Calculated columns in Power BI offer powerful data manipulation capabilities, enabling you to derive new insights from your existing data.
Let’s explore various techniques for transforming your data and unlocking valuable information.
Basic Calculations
Basic arithmetic operations form the foundation of data manipulation. Power BI allows you to perform addition, subtraction, multiplication, and division within calculated columns.
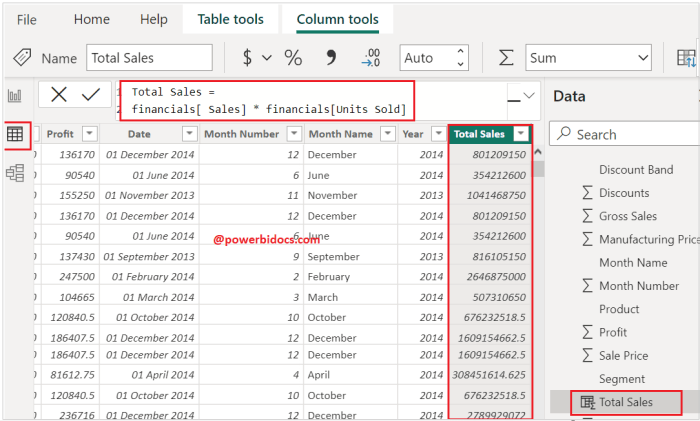
Here’s how you can add two columns:NewColumn = [Column1] + [Column2]Similarly, you can use ‘-‘, ‘*’, and ‘/’ for subtraction, multiplication, and division respectively.
Microsoft Power BI calculated columns are powerful tools for manipulating and analyzing data, just like how industry insiders carefully curate beauty picks. For example, imagine using a calculated column to analyze the data from Harvey Nichols’ five beauty picks chosen by industry insiders , allowing you to track trends, identify popular products, and make informed decisions about your own beauty routine.
With a calculated column, you can easily categorize and compare different products based on their features, reviews, and popularity, providing a more comprehensive and insightful view of the beauty industry.
For instance, you might calculate the total sales amount by adding the ‘Quantity’ and ‘Price’ columns.
Conditional Statements
Conditional statements are essential for creating dynamic calculated columns that respond to different data conditions. Power BI supports IF, ELSE, and CASE statements to control the logic of your calculations.
The IF statement evaluates a condition and returns one value if true and another if false:NewColumn = IF([Condition], [Value if True], [Value if False])
For example, you could create a calculated column ‘Discount Applied’ that indicates whether a discount was applied based on the ‘Discount Percentage’ column:
Discount Applied = IF([Discount Percentage] > 0, “Yes”, “No”)
Date and Time Functions
Power BI provides a rich set of functions for manipulating dates and times. You can extract specific parts of a date, calculate date differences, and format dates according to your needs.
The YEAR function extracts the year from a date:Year = YEAR([Date Column])The DATEDIFF function calculates the difference between two dates: DaysDifference = DATEDIFF( [StartDate], [EndDate], DAY)
For instance, you can create a calculated column ‘Age’ to calculate the age of customers based on their birth date.
String Functions
String functions allow you to manipulate text data within calculated columns. You can extract substrings, convert text to uppercase or lowercase, and perform other text transformations.
The LEFT function extracts characters from the beginning of a string:FirstName = LEFT([FullName], FIND(” “, [FullName])
1)
The UPPER function converts text to uppercase: UppercaseName = UPPER([Name])
For example, you can create a calculated column ‘Customer Initials’ by extracting the first letter from the ‘FirstName’ and ‘LastName’ columns.
Advanced Calculated Columns
Power BI calculated columns are a powerful tool for manipulating and analyzing data within your reports. While basic calculations are useful, advanced techniques unlock a whole new level of data exploration and insight. Let’s delve into these advanced techniques to see how they can empower your data analysis.
DAX Functions for Advanced Calculations
DAX (Data Analysis Expressions) functions are the building blocks of calculated columns. These functions enable you to perform complex operations on your data, transforming raw data into meaningful insights.
- Mathematical Functions:DAX provides a rich set of mathematical functions, including ABS, POWER, SQRT, and ROUND. These functions are crucial for manipulating numerical data, allowing you to perform calculations like finding absolute values, calculating exponents, extracting square roots, and rounding values.
- Logical Functions:DAX offers logical functions like IF, AND, OR, and NOT. These functions are invaluable for creating conditional calculations based on specific criteria within your data.
- Text Functions:DAX provides functions like CONCATENATE, LEFT, RIGHT, and FIND. These functions allow you to manipulate text data, combining strings, extracting specific parts of text, and finding specific characters within text strings.
- Date and Time Functions:DAX includes functions like DATE, YEAR, MONTH, and DAYfor working with dates and times. These functions are crucial for analyzing data based on time periods and extracting relevant information from date and time values.
Lookup Functions
Lookup functions are essential for retrieving data from related tables, enabling you to combine data from multiple sources and perform calculations across different tables.
- LOOKUPVALUE:This function allows you to retrieve a value from a related table based on a specific column and lookup value. For example, you could use LOOKUPVALUEto retrieve the sales price from a product table based on the product ID in your sales table.
- RELATED:This function returns a value from a related table based on the current row context. It’s particularly useful for retrieving a single value from a related table based on a matching key. For example, you could use RELATEDto retrieve the product name from the product table based on the product ID in your sales table.
- RELATEDTABLE:This function returns a table of related values from a related table based on the current row context. It’s helpful when you need to access multiple rows from a related table based on a matching key. For example, you could use RELATEDTABLEto retrieve all orders associated with a specific customer ID.
Iterators
Iterators are DAX functions that allow you to perform calculations across multiple rows in a table. They provide a powerful way to aggregate data and perform complex calculations on a row-by-row basis.
- SUMX:This function iterates through a table and calculates a sum based on a specific expression. It’s useful for calculating sums across multiple rows based on specific conditions. For example, you could use SUMXto calculate the total sales for each product by iterating through the sales table and summing the sales values for each product.
- CALCULATE:This function modifies the context of a calculation, allowing you to filter data or apply other modifications before performing a calculation. It’s a versatile function for creating dynamic calculations based on specific conditions. For example, you could use CALCULATEto calculate the total sales for a specific region by filtering the sales table to only include sales from that region.
Variables
Variables are temporary placeholders that store values within a DAX expression. They can improve code readability and performance by breaking down complex calculations into smaller, more manageable steps.
Example:“`SalesWithDiscount = VAR OriginalPrice = [Price]VAR DiscountRate = 0.1VAR DiscountAmount = OriginalPrice
DiscountRate
RETURN OriginalPrice
DiscountAmount
“`
In this example, the variable OriginalPricestores the value of the Pricecolumn, DiscountRatestores the discount rate, and DiscountAmountcalculates the discount amount. The final calculation then subtracts the discount amount from the original price. This approach makes the code more readable and easier to understand.
Best Practices and Optimization
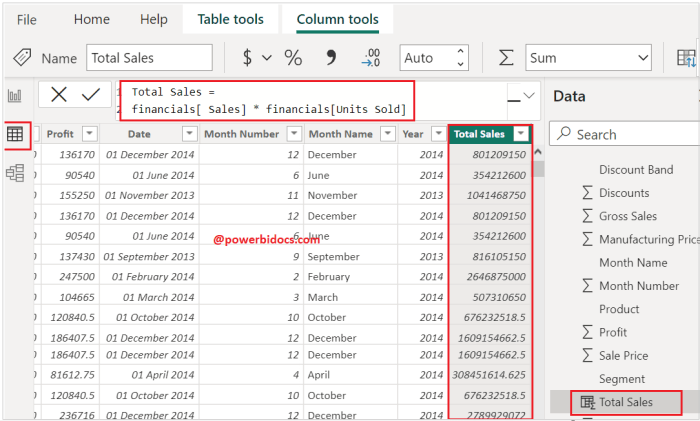
Calculated columns are a powerful feature in Power BI, allowing you to create new columns based on existing data. However, it’s crucial to write them efficiently and maintainably to ensure optimal performance. Let’s explore best practices and optimization techniques for calculated columns.
Impact of Calculated Columns on Performance
Calculated columns are evaluated for every row in your dataset, potentially impacting performance, especially when dealing with large datasets. The more complex the calculation, the longer it takes to process. It’s essential to be mindful of the performance implications when creating calculated columns.
Best Practices for Writing Efficient Calculated Columns
- Use Simple and Direct Calculations:Avoid overly complex formulas that involve multiple nested functions or calculations. Instead, break down complex logic into smaller, more manageable calculations.
- Minimize Redundant Calculations:If you need to perform the same calculation in multiple places, consider creating a separate measure instead of repeating the calculation in every calculated column. This reduces redundancy and improves performance.
- Leverage Power BI’s Built-in Functions:Utilize Power BI’s rich set of built-in functions to simplify your calculations. These functions are optimized for performance and can often achieve the desired results more efficiently than custom code.
- Avoid Unnecessary Data Transformations:If possible, perform data transformations in the data source itself before loading it into Power BI. This reduces the workload on the calculated columns, improving performance.
- Use Data Types Effectively:Choose the most appropriate data type for each column to ensure optimal performance. For example, if you only need to store integers, use the integer data type instead of a larger data type like decimal.
Optimizing Calculated Columns for Performance, Microsoft power bi calculated column
- Utilize DAX Optimization Techniques:DAX (Data Analysis Expressions) is the language used for writing calculated columns. Understanding DAX optimization techniques can significantly improve performance. For example, using the CALCULATE function with filters can optimize calculations for specific scenarios.
- Pre-Calculate Values:If a calculation involves frequently used values, consider pre-calculating these values and storing them in a separate table. This can significantly reduce the workload on calculated columns, improving performance.
- Use Measures Instead of Calculated Columns:If you need to perform calculations that are not dependent on individual rows, consider using measures instead of calculated columns. Measures are calculated only when needed, improving performance.
- Avoid Unnecessary Calculations:If a calculation is not required for all rows, consider using a conditional statement to only perform the calculation when necessary. This reduces the workload on calculated columns, improving performance.
Importance of Testing and Validating Calculated Columns
- Thorough Testing:After creating a calculated column, it’s crucial to test it thoroughly with various data scenarios to ensure it’s producing the expected results. This helps identify potential errors or inconsistencies early on.
- Validation:Compare the results of your calculated columns with the original data to ensure accuracy. This can involve manual verification or using validation techniques like unit testing.


