
Business Intelligence BI Tools: Unlocking Data Insights
Business intelligence BI tools are the key to unlocking hidden insights from your data, transforming raw information into actionable strategies. These powerful tools empower businesses to make informed decisions, optimize operations, and gain a competitive edge in today’s data-driven world.
Imagine having a crystal ball that reveals the future of your business, predicting trends and identifying opportunities before they even emerge. That’s the power of BI tools, and they are more accessible than ever before.
From data visualization dashboards that paint a clear picture of your performance to predictive analytics that anticipate future outcomes, BI tools come in various forms, each tailored to specific business needs. Whether you’re a small startup or a large enterprise, there’s a BI solution out there that can help you leverage your data to achieve your goals.
What is Business Intelligence (BI)?
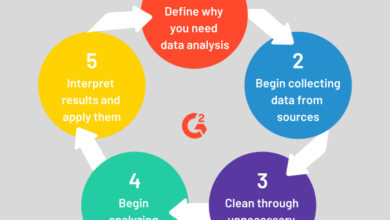
Business Intelligence (BI) is a powerful tool that helps organizations make informed decisions based on data analysis. It involves collecting, cleaning, analyzing, and interpreting data from various sources to gain insights into business performance, market trends, customer behavior, and other crucial areas.
By understanding the patterns and trends hidden within data, BI empowers businesses to make strategic decisions that drive growth, improve efficiency, and enhance customer satisfaction.
The Role of Business Intelligence in Decision-Making
BI plays a crucial role in enabling data-driven decision-making by providing organizations with a comprehensive view of their operations. By analyzing historical data, current trends, and market conditions, BI tools help businesses identify opportunities, anticipate challenges, and make informed choices that align with their strategic goals.
Key Components of a BI System
A typical BI system comprises several essential components that work together to deliver valuable insights. These components include:
- Data Source:The foundation of any BI system is its data source. This can include internal data from databases, spreadsheets, and applications, as well as external data from social media, market research, and industry reports.
- Data Extraction and Transformation:Once data is collected, it needs to be extracted from its source and transformed into a format suitable for analysis. This involves cleaning, standardizing, and integrating data from different sources.
- Data Storage and Management:Data warehouses and data lakes are used to store and manage large volumes of data efficiently. These systems provide a central repository for all the data used in BI analysis.
- Data Analysis and Visualization:BI tools offer a range of analytical techniques, such as statistical analysis, predictive modeling, and data mining. These tools allow users to explore data, identify patterns, and generate insights. Visualization tools, such as charts, graphs, and dashboards, present data in a clear and concise way, making it easy to understand and interpret.
- Reporting and Dashboards:BI systems generate reports and dashboards that summarize key performance indicators (KPIs) and provide a visual overview of business performance. These reports can be customized to meet specific needs and can be shared with stakeholders at different levels within the organization.
Benefits of Implementing BI Tools
Implementing BI tools can bring significant benefits to organizations, including:
- Improved Decision-Making:BI provides data-driven insights that support better decision-making. By analyzing data, organizations can gain a deeper understanding of their customers, markets, and operations, leading to more informed and strategic choices.
- Enhanced Efficiency:BI tools can automate tasks and processes, streamlining operations and reducing manual effort. This frees up employees to focus on more strategic activities.
- Increased Revenue and Profitability:By identifying growth opportunities and optimizing processes, BI can help organizations increase revenue and improve profitability. For example, by analyzing customer data, businesses can tailor their marketing campaigns and product offerings to specific customer segments, leading to higher conversion rates and increased sales.
- Competitive Advantage:Organizations that leverage BI effectively gain a competitive advantage by making faster and more informed decisions. They can respond quickly to market changes, identify new opportunities, and stay ahead of the competition.
- Improved Customer Satisfaction:By understanding customer behavior and preferences, BI tools can help businesses provide personalized experiences and improve customer service. This leads to higher customer satisfaction and loyalty.
Types of BI Tools

Business intelligence (BI) tools come in a variety of forms, each designed to address specific needs within an organization. Understanding the different types of BI tools and their functionalities is crucial for selecting the right solution for your organization’s requirements.
Business intelligence (BI) tools are essential for gaining insights from data, helping businesses make informed decisions. While BI tools might seem like a far cry from crafting a beautiful DIY wooden bead chandelier , both require a creative approach to achieve a desired outcome.
Just as you carefully select and arrange beads to create a stunning chandelier, BI tools allow you to visualize and analyze data, revealing hidden patterns and trends that can illuminate your business path.
Reporting Tools
Reporting tools are the foundation of any BI system. They provide a structured way to collect, organize, and present data in a clear and concise manner. Reporting tools typically allow users to create static reports that can be shared with stakeholders.
- Key Features:Data aggregation, filtering, sorting, and formatting.
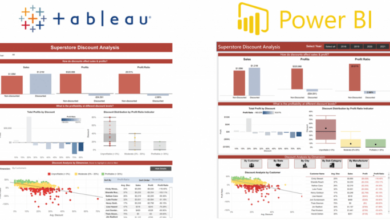
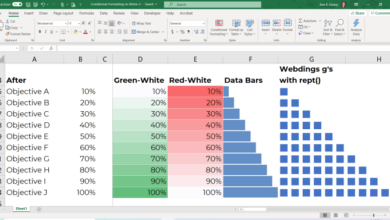
- Examples:Microsoft Excel, Tableau Desktop, Power BI Desktop, Qlik Sense.
Reporting tools excel at providing a comprehensive overview of data, but they lack the flexibility for in-depth analysis.
Analytics Tools
Analytics tools take BI a step further by enabling users to analyze data and uncover insights. These tools offer advanced features for data exploration, statistical analysis, and predictive modeling.
- Key Features:Statistical functions, data mining, and forecasting.
- Examples:SAS, SPSS, R, Python, Alteryx.
Analytics tools are essential for uncovering hidden patterns and trends in data, allowing businesses to make informed decisions.
Data Visualization Tools
Data visualization tools transform raw data into visually appealing and easily understandable charts, graphs, and dashboards. They help users quickly grasp complex data patterns and communicate insights effectively.
- Key Features:Interactive dashboards, custom charts, and map visualizations.
- Examples:Tableau Public, Power BI, Google Data Studio, Qlik Sense.
Data visualization tools are crucial for presenting data in a compelling and engaging manner, facilitating communication and understanding.
Predictive Modeling Tools, Business intelligence bi tools
Predictive modeling tools leverage statistical algorithms and machine learning techniques to forecast future trends and outcomes. They are essential for making proactive decisions based on historical data and anticipated patterns.
- Key Features:Regression analysis, classification algorithms, and time series forecasting.
- Examples:SAS Enterprise Miner, SPSS Modeler, Python libraries like scikit-learn.
Predictive modeling tools empower businesses to anticipate future events and make informed decisions based on data-driven insights.
Key Features of BI Tools
Business Intelligence (BI) tools are designed to help organizations make sense of their data and gain valuable insights. These tools offer a range of features that support data analysis, reporting, and decision-making. Understanding the key features of BI tools is crucial for choosing the right tool for your specific needs and maximizing its benefits.
Data Integration
Data integration is a critical aspect of BI, as it involves combining data from various sources into a unified view. This process allows organizations to get a comprehensive understanding of their business operations by analyzing data from different departments, systems, and applications.
Business intelligence BI tools are essential for making data-driven decisions, and understanding the gaming landscape is crucial for many companies. A recent article on gamesbeat profile samsung next highlights Samsung’s ambitions in the gaming space, which could be valuable information for companies using BI tools to analyze market trends and identify potential opportunities in the gaming industry.
Here are some of the key benefits of data integration in BI:
- Improved Data Accuracy and Consistency:By consolidating data from multiple sources, BI tools can help eliminate inconsistencies and errors that may exist in individual data silos.
- Enhanced Data Visibility:Data integration provides a holistic view of data across the organization, enabling better insights and decision-making.
- Streamlined Data Analysis:With integrated data, BI tools can perform complex analyses and generate comprehensive reports more efficiently.
Data Cleaning and Transformation
Data cleaning and transformation are essential processes in BI to ensure data quality and prepare it for analysis.
- Data Cleaning:This process involves identifying and removing errors, inconsistencies, and duplicates from data sets. It ensures that the data used for analysis is accurate and reliable.
- Data Transformation:This process involves converting data into a format suitable for analysis. It may include tasks like data aggregation, data normalization, and data enrichment.
Data Visualization and Dashboards
Data visualization and dashboards are powerful tools for presenting insights and communicating complex information effectively.
Business intelligence (BI) tools are powerful for analyzing data and making informed decisions, just like a skilled chef uses their tools to create a culinary masterpiece. Sometimes, the most unexpected combinations can be surprisingly delicious, like the peanut butter and jam bubble waffles that recently caught my eye.
While BI tools are essential for business success, remember that creativity and a willingness to try new things can lead to unexpected and delightful results.
- Data Visualization:BI tools offer a variety of visualization techniques, such as charts, graphs, maps, and tables, to present data in an easily understandable and engaging way.
- Dashboards:Dashboards provide a centralized view of key performance indicators (KPIs) and other critical data points, enabling users to monitor business performance and identify trends quickly.
Data visualization and dashboards are essential for making data-driven decisions, as they provide a clear and concise overview of key insights.
Applications of BI Tools: Business Intelligence Bi Tools
Business Intelligence (BI) tools are not limited to a specific industry or department; they are widely adopted across various sectors to address a multitude of business challenges and enhance decision-making.
Industries Where BI Tools Are Used
BI tools find applications in a wide range of industries, each with its unique requirements and challenges. Here are some examples:
- Retail:BI tools are crucial for retailers to analyze customer behavior, predict demand, optimize inventory management, personalize marketing campaigns, and track sales performance. They can identify trends, understand customer preferences, and make informed decisions about pricing, promotions, and product assortment.
- Finance:Financial institutions leverage BI tools for risk management, fraud detection, customer relationship management, investment analysis, and regulatory compliance. They can analyze market trends, assess financial performance, identify investment opportunities, and manage risks effectively.
- Healthcare:BI tools play a vital role in healthcare by analyzing patient data, improving patient outcomes, optimizing resource allocation, and managing costs. They can identify disease patterns, predict hospital readmissions, track patient satisfaction, and support clinical decision-making.
- Manufacturing:Manufacturers use BI tools to optimize production processes, manage supply chains, track inventory levels, monitor equipment performance, and analyze customer feedback. They can identify bottlenecks, improve efficiency, reduce costs, and enhance product quality.
- Telecommunications:Telecommunications companies use BI tools to analyze customer usage patterns, optimize network performance, predict churn, personalize customer service, and develop new products and services. They can identify customer segments, understand their needs, and provide targeted solutions.
Departments Where BI Tools Are Used
BI tools are not confined to specific departments but are used across various functions within an organization, enabling data-driven decision-making.
- Sales & Marketing:BI tools help sales and marketing teams analyze customer data, identify target audiences, track campaign performance, personalize marketing messages, and forecast sales. They can optimize marketing spend, improve conversion rates, and enhance customer engagement.
- Finance:Finance departments use BI tools for financial reporting, budgeting, forecasting, risk management, and investment analysis. They can analyze financial data, identify trends, track performance, and make informed decisions about resource allocation and investment strategies.
- Operations:Operations teams rely on BI tools to optimize processes, improve efficiency, manage inventory, track production performance, and monitor supply chain operations. They can identify bottlenecks, reduce waste, enhance productivity, and improve customer satisfaction.
- Human Resources:HR departments use BI tools for talent management, employee engagement, performance analysis, and workforce planning. They can analyze employee data, identify trends, track performance, and make informed decisions about recruitment, training, and development.
- IT:IT departments use BI tools to monitor system performance, analyze network traffic, track security incidents, and optimize infrastructure. They can identify performance bottlenecks, troubleshoot issues, and improve system reliability.
Real-World Examples of BI Tool Applications
- Predictive Maintenance in Manufacturing:A manufacturing company uses BI tools to analyze sensor data from machines and predict potential failures before they occur. This allows them to schedule preventive maintenance, reduce downtime, and minimize production disruptions.
- Customer Segmentation in Retail:A retail company uses BI tools to segment customers based on their purchase history, demographics, and browsing behavior. This allows them to personalize marketing campaigns, offer targeted promotions, and enhance customer experience.
- Fraud Detection in Finance:A financial institution uses BI tools to analyze transaction data and identify suspicious patterns that indicate potential fraud. This helps them prevent financial losses, protect customers, and maintain compliance with regulations.
- Patient Outcome Analysis in Healthcare:A healthcare provider uses BI tools to analyze patient data and identify factors that influence treatment outcomes. This allows them to improve care protocols, personalize treatment plans, and enhance patient satisfaction.
- Network Optimization in Telecommunications:A telecommunications company uses BI tools to analyze network traffic patterns and optimize network performance. This allows them to improve service quality, reduce network congestion, and enhance customer experience.
Impact of BI on Decision-Making and Business Outcomes
BI tools have a significant impact on decision-making and business outcomes by providing insights that are:
- Data-driven:BI tools rely on data analysis to provide objective insights, reducing reliance on intuition or guesswork.
- Actionable:BI tools present insights in a clear and concise manner, enabling users to take informed actions.
- Real-time:BI tools can access and analyze data in real time, providing up-to-date insights for agile decision-making.
- Predictive:BI tools can analyze historical data to predict future trends, enabling organizations to anticipate challenges and opportunities.
The use of BI tools can lead to:
- Improved Decision-Making:By providing data-driven insights, BI tools empower organizations to make more informed and effective decisions.
- Increased Efficiency:BI tools can help optimize processes, reduce waste, and improve productivity, leading to increased efficiency.
- Enhanced Customer Experience:BI tools can help personalize customer interactions, improve service quality, and increase customer satisfaction.
- Competitive Advantage:By leveraging data insights, organizations can gain a competitive advantage by identifying market trends, anticipating customer needs, and developing innovative solutions.
- Reduced Costs:BI tools can help organizations identify cost savings opportunities, optimize resource allocation, and improve operational efficiency.
- Increased Revenue:BI tools can help organizations increase revenue by improving sales performance, optimizing marketing campaigns, and developing new products and services.
Choosing the Right BI Tool
Selecting the right BI tool is crucial for any organization seeking to leverage data-driven insights for informed decision-making. The process involves considering various factors and evaluating different tools based on their features, pricing, and ease of use.
Factors to Consider When Selecting a BI Tool
The choice of a BI tool should align with specific business needs and objectives. Here are some key factors to consider:
- Business Requirements: Define the specific data analysis tasks, reporting needs, and desired insights. Consider the complexity of data, the types of reports required, and the level of customization needed.
- Data Sources: Identify the sources of data that will be integrated into the BI tool. Determine the types of data (structured, unstructured, real-time, historical) and the volume of data to be processed.
- User Skills: Assess the technical expertise of users who will interact with the BI tool. Choose a tool with a user interface that is intuitive and easy to navigate, especially if users have limited technical skills.
- Scalability and Performance: Consider the future growth of data and the need for scalability. Choose a tool that can handle increasing data volumes and complex queries without compromising performance.
- Integration Capabilities: Ensure the BI tool integrates seamlessly with existing systems and applications, such as databases, CRM, ERP, and cloud platforms.
- Security and Compliance: Evaluate the tool’s security features, data encryption, and compliance with industry standards and regulations.
- Cost and Budget: Determine the budget allocated for the BI tool, including licensing fees, implementation costs, and ongoing maintenance.
Comparing and Contrasting BI Tools
Once you have identified the key factors, it’s essential to compare and contrast different BI tools based on their features, pricing, and ease of use.
- Features: Compare the tools’ capabilities in terms of data visualization, reporting, data mining, predictive analytics, and dashboards. Consider the availability of advanced features like machine learning, natural language processing, and geospatial analysis.
- Pricing: Evaluate the pricing models, including subscription fees, per-user costs, and deployment options (cloud-based, on-premises). Consider the long-term cost of ownership, including maintenance, support, and upgrades.
- Ease of Use: Assess the user interface, navigation, and overall usability. Consider the learning curve for users and the availability of training materials and support.
Recommendations for Selecting the Most Appropriate BI Solution
To choose the most appropriate BI solution, consider the following recommendations:
- Start with a clear understanding of your business needs. Define the specific problems you want to solve and the insights you seek to gain.
- Evaluate a range of BI toolsthat align with your requirements and budget. Conduct thorough research and compare different options based on features, pricing, and ease of use.
- Request demos and trialsto experience the tools firsthand and assess their usability and functionality.
- Consider the long-term implicationsof your choice, including scalability, integration, and support.
- Involve key stakeholdersin the decision-making process, including business users, IT professionals, and data analysts.
Implementing BI Tools

Implementing a Business Intelligence (BI) system can be a complex and challenging process, but it can also be incredibly rewarding. A well-designed and implemented BI system can provide valuable insights into your business, helping you make better decisions and improve performance.
Steps Involved in Implementing a BI System
Implementing a BI system requires careful planning and execution. The following steps Artikel a typical implementation process:
- Define Business Requirements:Clearly define your business objectives and the specific information needs that the BI system should address. This includes identifying key performance indicators (KPIs) and the data sources required for analysis.
- Select BI Tools:Choose BI tools that meet your specific requirements, considering factors like data volume, user needs, integration capabilities, and budget. The market offers a wide range of BI tools, from open-source solutions to enterprise-grade platforms.
- Data Integration and Preparation:Ensure that data from various sources is integrated and cleansed to create a single, consistent data warehouse. This involves data transformation, cleaning, and validation to ensure accuracy and reliability.
- Build Data Models and Reports:Design data models and create reports and dashboards that visualize the key information and insights. These should be tailored to the specific needs of different user groups within the organization.
- User Training and Adoption:Provide comprehensive training to users on how to access, interpret, and utilize the BI system effectively. Encourage user adoption by demonstrating the value and benefits of the system.
- Monitoring and Maintenance:Regularly monitor the BI system’s performance and make necessary adjustments to ensure data accuracy, report quality, and user satisfaction. Implement a maintenance schedule to address any issues and keep the system up-to-date.
Challenges Associated with BI Implementation
Implementing a BI system can present several challenges, including:
- Data Quality Issues:Inconsistent data formats, missing data, and data errors can significantly impact the accuracy and reliability of BI insights. Addressing data quality issues is crucial for successful BI implementation.
- Integration Complexity:Integrating data from multiple sources can be complex, especially in large organizations with diverse systems and data formats. This requires careful planning and potentially the use of data integration tools.
- User Adoption and Training:Ensuring user adoption and providing adequate training are essential for realizing the full potential of the BI system. Resistance to change and lack of understanding can hinder user engagement.
- Cost and Time Investment:Implementing a BI system can be a significant investment in terms of time, resources, and budget. Balancing cost-effectiveness with the desired functionality is crucial.
- Data Security and Privacy:Protecting sensitive data and ensuring compliance with privacy regulations is critical when implementing a BI system. This involves implementing appropriate security measures and data governance policies.
Tips for Ensuring Successful Adoption and Utilization of BI Tools
To maximize the success of your BI implementation, consider these tips:
- Involve Key Stakeholders:Engage key stakeholders from different departments and levels of the organization to ensure alignment with business needs and to build support for the BI system.
- Start Small and Iterate:Begin with a pilot project focusing on a specific business area or use case. This allows for iterative development and refinement of the BI system based on feedback and results.
- Focus on User Experience:Design user-friendly dashboards and reports that are easy to understand and navigate. Provide clear and concise information tailored to the specific needs of different user groups.
- Promote a Data-Driven Culture:Encourage data-driven decision-making throughout the organization by promoting the use of BI insights and fostering a culture of data literacy.
- Continuous Improvement:Regularly assess the BI system’s performance and make necessary adjustments to improve its effectiveness and address evolving business needs.
Future Trends in BI
Business Intelligence (BI) is a dynamic field constantly evolving to keep pace with the rapid advancements in technology and the ever-changing needs of businesses. The future of BI holds exciting possibilities, with several emerging trends poised to revolutionize how organizations gather, analyze, and utilize data.
The Impact of Artificial Intelligence (AI) and Machine Learning (ML) on BI
AI and ML are transforming the landscape of BI by automating complex tasks, enhancing data analysis capabilities, and providing deeper insights. These technologies are enabling BI tools to:
- Automate Data Preparation and Cleaning:AI-powered tools can automatically cleanse and prepare data for analysis, saving time and effort for analysts.
- Generate Predictive Models:ML algorithms can create sophisticated predictive models, enabling organizations to forecast future trends and make informed decisions. For instance, retailers can use these models to predict customer demand and optimize inventory management.
- Personalize Dashboards and Reports:AI can personalize BI dashboards and reports based on user preferences and roles, providing a more relevant and engaging experience.
- Identify Patterns and Anomalies:AI can analyze vast amounts of data to identify hidden patterns and anomalies that may not be visible to human analysts. This helps businesses detect fraud, identify market opportunities, and improve operational efficiency.
The Rise of Cloud-Based BI Solutions
Cloud-based BI solutions are gaining popularity due to their scalability, affordability, and ease of deployment. Cloud BI platforms offer several advantages:
- Scalability:Cloud-based solutions can easily scale to accommodate growing data volumes and user demands.
- Cost-Effectiveness:Cloud BI eliminates the need for expensive hardware and software infrastructure, making it a cost-effective option for businesses of all sizes.
- Accessibility:Cloud BI platforms can be accessed from anywhere with an internet connection, enabling users to work remotely and collaborate seamlessly.
- Rapid Deployment:Cloud BI solutions can be deployed quickly, allowing businesses to start analyzing data and gaining insights in a shorter time frame.
The Importance of Mobile Analytics
Mobile analytics is becoming increasingly crucial as businesses need to access and analyze data on the go. Mobile BI apps provide users with real-time insights, enabling them to make informed decisions anytime, anywhere.
- Real-time Insights:Mobile BI apps provide real-time data visualizations and dashboards, allowing users to stay informed about key business metrics.
- Increased Accessibility:Mobile BI empowers users to access data and insights from their smartphones or tablets, eliminating the need to be tied to a desktop computer.
- Improved Decision-Making:Mobile BI enables users to make data-driven decisions quickly and efficiently, regardless of their location.