What Is a Balance Sheet and Why It Matters
What is balance sheet – What is a balance sheet? It’s more than just a boring financial document – it’s a snapshot of a company’s financial health at a specific point in time. Imagine it as a detailed photograph revealing what a company owns (assets), what it owes (liabilities), and how much the owners have invested (equity).
This intricate equation helps paint a clear picture of a company’s financial standing, and it’s a vital tool for investors, creditors, and management alike.
Understanding the balance sheet unlocks a world of financial insights. It reveals how much a company has invested in its operations, how much debt it carries, and how much profit it has generated. This information is crucial for making informed decisions about investments, lending, and overall business strategy.
Definition of a Balance Sheet
A balance sheet is a financial statement that provides a snapshot of a company’s financial position at a specific point in time. It presents a detailed picture of what a company owns (assets), what it owes (liabilities), and the value of the owners’ investment (equity).
Purpose of a Balance Sheet
The balance sheet serves several critical purposes:
- Assessing financial health:It helps investors, lenders, and creditors evaluate a company’s solvency and financial stability. A strong balance sheet indicates a company is well-positioned to meet its obligations and potentially grow.
- Evaluating profitability:It provides insights into how efficiently a company uses its assets to generate profits. For example, a high level of assets compared to equity might suggest a company is over-leveraged, which could indicate a higher risk profile.
- Tracking performance over time:By comparing balance sheets from different periods, stakeholders can identify trends in a company’s financial position, such as changes in asset holdings, debt levels, or equity value.
- Supporting decision-making:The balance sheet informs various financial decisions, including investment strategies, loan applications, and dividend payouts. It helps stakeholders understand the company’s financial capacity to support these decisions.
Key Components of a Balance Sheet
The balance sheet is structured around three fundamental components: assets, liabilities, and equity.
- Assets:These represent the company’s possessions, including resources it owns and controls that have economic value. Assets are typically categorized as current assets (liquid assets that can be converted to cash within a year) and non-current assets (long-term assets, such as property, plant, and equipment).
- Liabilities:These represent the company’s financial obligations to others, such as debts, accounts payable, and accrued expenses. Liabilities are categorized as current liabilities (obligations due within a year) and non-current liabilities (long-term obligations).
- Equity:This represents the owners’ investment in the company, including the original capital contributed and accumulated profits. It reflects the value of the company that belongs to its owners after all liabilities have been settled.
Simple Example of a Balance Sheet
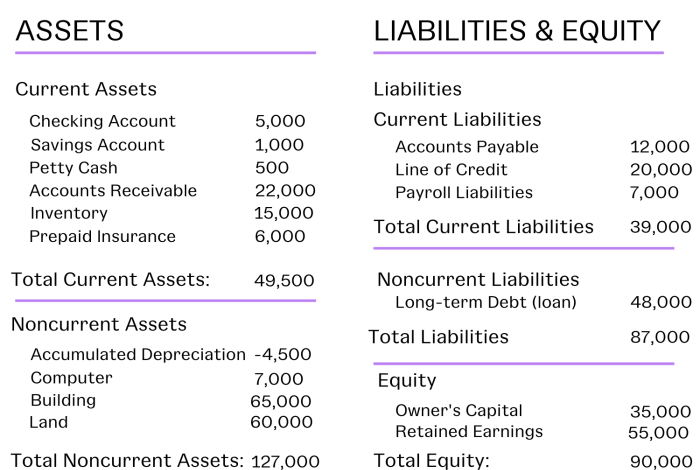
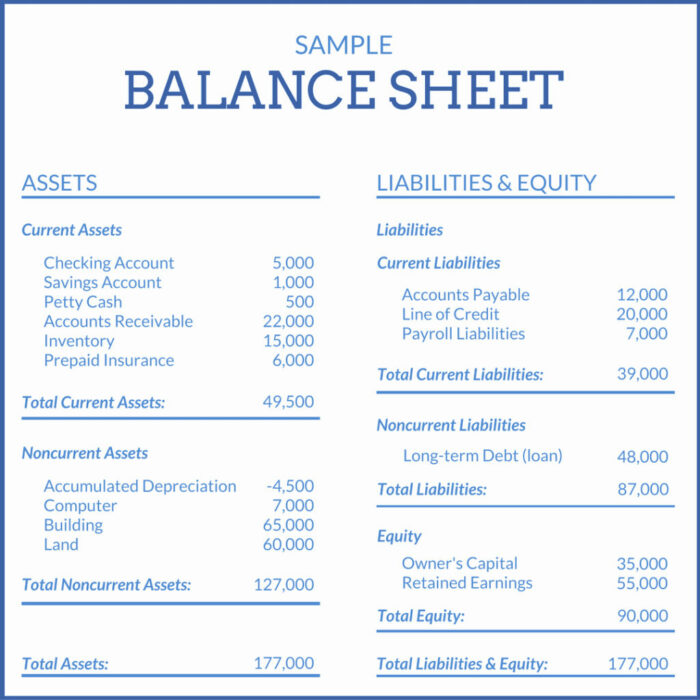
Here’s a simplified example of a balance sheet for a hypothetical company called “ABC Company”:
| ABC Company | Balance Sheet | As of December 31, 2023 |
|---|---|---|
| Assets | ||
| Current Assets | ||
| Cash | $10,000 | |
| Accounts Receivable | $5,000 | |
| Inventory | $15,000 | |
| Total Current Assets | $30,000 | |
| Non-Current Assets | ||
| Property, Plant, and Equipment | $50,000 | |
| Total Non-Current Assets | $50,000 | |
| Total Assets | $80,000 | |
| Liabilities | ||
| Current Liabilities | ||
| Accounts Payable | $10,000 | |
| Salaries Payable | $5,000 | |
| Total Current Liabilities | $15,000 | |
| Non-Current Liabilities | ||
| Long-Term Debt | $20,000 | |
| Total Non-Current Liabilities | $20,000 | |
| Total Liabilities | $35,000 | |
| Equity | ||
| Share Capital | $25,000 | |
| Retained Earnings | $20,000 | |
| Total Equity | $45,000 | |
| Total Liabilities and Equity | $80,000 |
The fundamental accounting equation, Assets = Liabilities + Equity, is reflected in the balance sheet. This equation ensures that the total value of a company’s assets is always equal to the sum of its liabilities and equity.
Assets
Assets are the resources owned by a company that have economic value and are expected to provide future benefits. These benefits can be in the form of cash flows, increased sales, or reduced expenses. Assets are listed on the balance sheet, which provides a snapshot of a company’s financial position at a specific point in time.
Types of Assets
Assets can be classified into two main categories: tangible and intangible.
- Tangible assetsare physical items that have a real, measurable value. These assets can be touched and seen. Examples include:
- Property, plant, and equipment (PP&E):This category includes land, buildings, machinery, vehicles, and other fixed assets used in the company’s operations.
- Inventory:This refers to raw materials, work-in-progress, and finished goods that a company holds for sale.
- Cash and cash equivalents:This includes currency, checking and savings accounts, and short-term investments that can be easily converted into cash.
- Intangible assetsare non-physical assets that have value but cannot be touched or seen. They represent the company’s rights, privileges, or competitive advantages. Examples include:
- Patents:Exclusive rights granted to an inventor to use, sell, or manufacture an invention.
- Copyrights:Exclusive rights granted to authors or creators of original works of authorship, such as books, music, and software.
A balance sheet is a financial statement that shows a company’s assets, liabilities, and equity at a specific point in time. It’s like a snapshot of a company’s financial health. Thinking about a balance sheet can be a little dry, but it’s kind of like a DIY project – you’re taking separate components and putting them together to create a bigger picture.
For example, when you’re making a DIY twist back top , you’re combining fabric, thread, and your own creativity to make something unique. Just like that, a balance sheet shows how all the different parts of a company come together to form its overall financial position.
- Trademarks:Distinctive signs or symbols used to identify and distinguish a company’s products or services.
- Goodwill:The value of a company’s reputation, customer relationships, and brand recognition.
Liquidity of Assets
Assets can also be classified based on their liquidity, which refers to how easily they can be converted into cash.
- Current assetsare assets that are expected to be converted into cash within one year. They include:
- Cash and cash equivalents:These are the most liquid assets, as they can be readily used to pay for expenses or invest in other assets.
- Accounts receivable:This represents the amount of money owed to the company by its customers for goods or services already delivered.
- Inventory:This is considered a current asset because it is expected to be sold within a year.
- Prepaid expenses:These are expenses that have been paid in advance, such as rent or insurance premiums.
- Non-current assetsare assets that are expected to be held for more than one year. They include:
- Property, plant, and equipment (PP&E):These assets are typically used for a long period and are not expected to be sold within a year.
- Intangible assets:These assets are also considered non-current because they provide benefits over a long period.
- Long-term investments:These are investments that are expected to be held for more than a year.
Common Asset Accounts
Here are some examples of common asset accounts and their corresponding account balances:
| Account | Balance |
|---|---|
| Cash | $100,000 |
| Accounts Receivable | $50,000 |
| Inventory | $75,000 |
| Property, Plant, and Equipment | $500,000 |
| Goodwill | $100,000 |
Liabilities
Liabilities represent a company’s financial obligations to external parties. These obligations are essentially debts that the company owes and must repay in the future. Understanding liabilities is crucial because they affect a company’s financial health and its ability to meet its financial obligations.
A balance sheet is a financial statement that shows a company’s assets, liabilities, and equity at a specific point in time. It’s a snapshot of a company’s financial health, much like a curated beauty routine can reflect a person’s overall well-being.
Speaking of well-being, if you’re looking for some beauty inspiration, check out Harvey Nichols’ five beauty picks chosen by industry insiders. Just as a balanced sheet demonstrates a company’s financial stability, a well-balanced beauty routine can help you feel confident and radiant.
Types of Liabilities
Liabilities can be categorized into two main types: short-term and long-term liabilities. The distinction between these two types lies in the time frame within which the company is expected to settle the obligation.
Short-Term Liabilities
Short-term liabilities, also known as current liabilities, are financial obligations that are due within a year or within the company’s operating cycle, whichever is longer. These liabilities are typically settled using current assets, such as cash or accounts receivable.
- Accounts Payable:This represents the amount owed to suppliers for goods or services that have been received but not yet paid for. Accounts payable typically have short payment terms, often ranging from 30 to 90 days.
- Salaries Payable:This represents the amount owed to employees for work performed but not yet paid. Salaries are usually paid on a regular schedule, such as weekly, bi-weekly, or monthly.
- Short-Term Loans:These are loans with a maturity date of less than one year. Examples include lines of credit, overdraft protection, and short-term commercial loans.
- Deferred Revenue:This represents payments received for goods or services that will be delivered in the future. For example, if a company sells a subscription service, the revenue from the subscription is deferred until the service is actually provided.
Long-Term Liabilities
Long-term liabilities, also known as non-current liabilities, are financial obligations that are due beyond one year or the operating cycle. These liabilities typically require a longer time frame to repay and are often secured by assets, such as real estate or equipment.
A balance sheet is a financial statement that shows a company’s assets, liabilities, and equity at a specific point in time. It’s like a snapshot of the company’s financial health. For example, if you’re thinking about investing in a company, you might want to check out their balance sheet to see how much debt they have and how much equity they have.
You can also use a balance sheet to track your own personal finances, like keeping track of your savings, investments, and debts. And if you’re a coffee lover, you might want to check out this Nespresso complimentary coffee make offer to get your caffeine fix while keeping your budget in check.
Of course, don’t forget to keep track of your spending in your personal balance sheet!
- Long-Term Loans:These are loans with a maturity date of more than one year. Examples include mortgages, commercial loans, and equipment financing.
- Bonds Payable:These are debt securities issued by companies to raise capital. Bondholders are essentially lenders who receive interest payments on their investment.
- Deferred Tax Liabilities:This represents the amount of taxes that are expected to be paid in the future, due to differences in accounting treatment for tax purposes and financial reporting purposes.
- Leases:These are agreements that allow a company to use an asset, such as a building or equipment, for a specific period of time in exchange for regular payments.
Equity: What Is Balance Sheet
Equity represents the owner’s stake in a business. It signifies the residual value of the assets after subtracting all liabilities. Think of it as the difference between what a company owns (assets) and what it owes (liabilities).
Components of Equity
Equity is composed of various components that reflect the sources of funding for the business. Two primary components are:
- Contributed Capital: This represents the initial investment made by the owners in the business. It can include funds raised through the sale of stock, direct contributions, or initial investments.
- Retained Earnings: This portion of equity represents the accumulated profits that have not been distributed to owners as dividends. It reflects the company’s earnings that have been reinvested back into the business.
Impact of Transactions on Equity
Equity can be impacted by various transactions that affect the assets and liabilities of a business. Here are some examples:
- Issuing new shares of stock: When a company issues new shares of stock, it increases the contributed capital component of equity, as it receives funds from investors in exchange for ownership. This directly increases the equity balance.
- Generating profit: When a company generates profit, its retained earnings increase. This is because profit is added to the accumulated earnings that are not distributed to owners.
- Paying dividends: When a company pays dividends to its shareholders, it reduces retained earnings, as it is distributing a portion of its accumulated profits to owners.
- Taking on debt: When a company takes on debt, it increases its liabilities. This does not directly impact equity, but it can indirectly affect it if the company uses the debt to purchase assets.
The Accounting Equation
The accounting equation is the fundamental principle underlying all accounting. It represents the relationship between a company’s assets, liabilities, and equity. This equation is essential for understanding how a business is financed and how its resources are used.
The Equation
The accounting equation states that:
Assets = Liabilities + Equity
This equation demonstrates that a company’s assets are financed by either liabilities (money owed to others) or equity (the owners’ investment in the company).
Applying the Equation to the Balance Sheet
The balance sheet is a financial statement that presents a snapshot of a company’s assets, liabilities, and equity at a specific point in time. The balance sheet is structured to reflect the accounting equation, with assets listed on one side and liabilities and equity listed on the other.
The total value of assets must always equal the total value of liabilities and equity.
Impact of Changes on the Equation, What is balance sheet
Changes in one element of the accounting equation will inevitably affect the other elements. For example:
- If a company takes out a loan, its assets (cash) will increase, and its liabilities (loans payable) will also increase. The equity remains unchanged.
- If a company purchases equipment with cash, its assets (equipment) will increase, and its assets (cash) will decrease. The liabilities and equity remain unchanged.
- If a company issues new shares of stock, its equity will increase, and its assets (cash) will also increase. The liabilities remain unchanged.
Balance Sheet Analysis
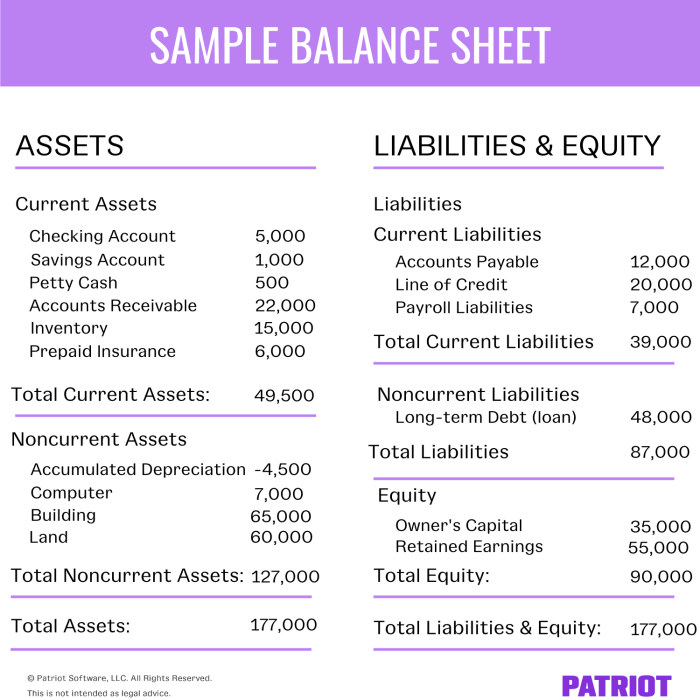
The balance sheet is a static snapshot of a company’s financial position at a specific point in time. However, analyzing this snapshot can reveal valuable insights into a company’s financial health and performance. By comparing balance sheets over time, analysts can identify trends and patterns that signal potential risks or opportunities.
Liquidity Ratios
Liquidity ratios measure a company’s ability to meet its short-term obligations. These ratios are crucial for assessing a company’s immediate financial health and its ability to cover its debts as they come due.
- Current Ratio: This ratio compares a company’s current assets to its current liabilities. A higher current ratio indicates a stronger ability to meet short-term obligations.
Current Ratio = Current Assets / Current Liabilities
- Quick Ratio: This ratio is similar to the current ratio but excludes inventory, which can be less liquid. A higher quick ratio suggests a more immediate ability to cover short-term debts.
Quick Ratio = (Current Assets- Inventory) / Current Liabilities
- Cash Ratio: This ratio measures a company’s ability to meet its short-term obligations using only cash and cash equivalents. A higher cash ratio indicates a greater ability to cover immediate debts.
Cash Ratio = (Cash + Cash Equivalents) / Current Liabilities
For example, a company with a current ratio of 2.0 has $2 in current assets for every $1 in current liabilities. This suggests a strong ability to meet short-term obligations. However, a company with a current ratio of 0.5 may have difficulty meeting its short-term obligations.
Solvency Ratios
Solvency ratios measure a company’s ability to meet its long-term obligations. These ratios provide insights into a company’s overall financial stability and its ability to survive over the long term.
- Debt-to-Equity Ratio: This ratio measures the amount of debt a company uses to finance its assets relative to the amount of equity. A higher debt-to-equity ratio indicates a greater reliance on debt financing, which can increase financial risk.
Debt-to-Equity Ratio = Total Debt / Shareholder Equity
- Times Interest Earned Ratio: This ratio measures a company’s ability to cover its interest expense with its earnings before interest and taxes (EBIT). A higher times interest earned ratio suggests a greater ability to meet interest payments.
Times Interest Earned Ratio = EBIT / Interest Expense
- Debt-to-Asset Ratio: This ratio measures the proportion of a company’s assets financed by debt. A higher debt-to-asset ratio indicates a greater reliance on debt financing, which can increase financial risk.
Debt-to-Asset Ratio = Total Debt / Total Assets
For example, a company with a debt-to-equity ratio of 1.0 has $1 in debt for every $1 in equity. This suggests a significant reliance on debt financing. A company with a times interest earned ratio of 5.0 can cover its interest expense five times over with its EBIT, indicating a strong ability to meet interest payments.
Profitability Ratios
Profitability ratios measure a company’s ability to generate profits from its operations. These ratios provide insights into a company’s efficiency and its ability to create value for its shareholders.
- Gross Profit Margin: This ratio measures the percentage of sales revenue that remains after deducting the cost of goods sold (COGS). A higher gross profit margin indicates a greater ability to generate profits from each dollar of sales.
Gross Profit Margin = (Sales Revenue- COGS) / Sales Revenue
- Operating Profit Margin: This ratio measures the percentage of sales revenue that remains after deducting operating expenses. A higher operating profit margin indicates a greater ability to generate profits from its core business operations.
Operating Profit Margin = Operating Income / Sales Revenue
- Net Profit Margin: This ratio measures the percentage of sales revenue that remains after deducting all expenses, including interest and taxes. A higher net profit margin indicates a greater ability to generate profits for its shareholders.
Net Profit Margin = Net Income / Sales Revenue
For example, a company with a gross profit margin of 40% generates $0.40 in profit for every $1 in sales revenue. A company with an operating profit margin of 20% generates $0.20 in profit for every $1 in sales revenue after deducting operating expenses.


