The Ultimate Guide to Social Media Dashboards: Types, Metrics, and Tools for Modern Enterprise Marketing Teams


As global social media ad spending continues its rapid ascent—projected to surpass $121 billion in the United States alone—the complexity of managing multi-channel digital strategies has scaled exponentially for enterprise marketing teams, digital agencies, and growing brands. Navigating the fragmented ecosystem of Instagram, LinkedIn, Facebook, TikTok, and X independently has become an operational liability, driving the urgent demand for centralized performance tracking. A social media dashboard acts as a single, unified interface that aggregates metrics from disparate networks into one place, enabling teams to track, analyze, and report on campaign performance without logging into native applications individually. By providing real-time data visualizations, automated reporting mechanisms, and deep cross-platform integration, these tools bridge the gap between creative execution and demonstrable business outcomes.

Understanding the Four Core Dashboard Categories
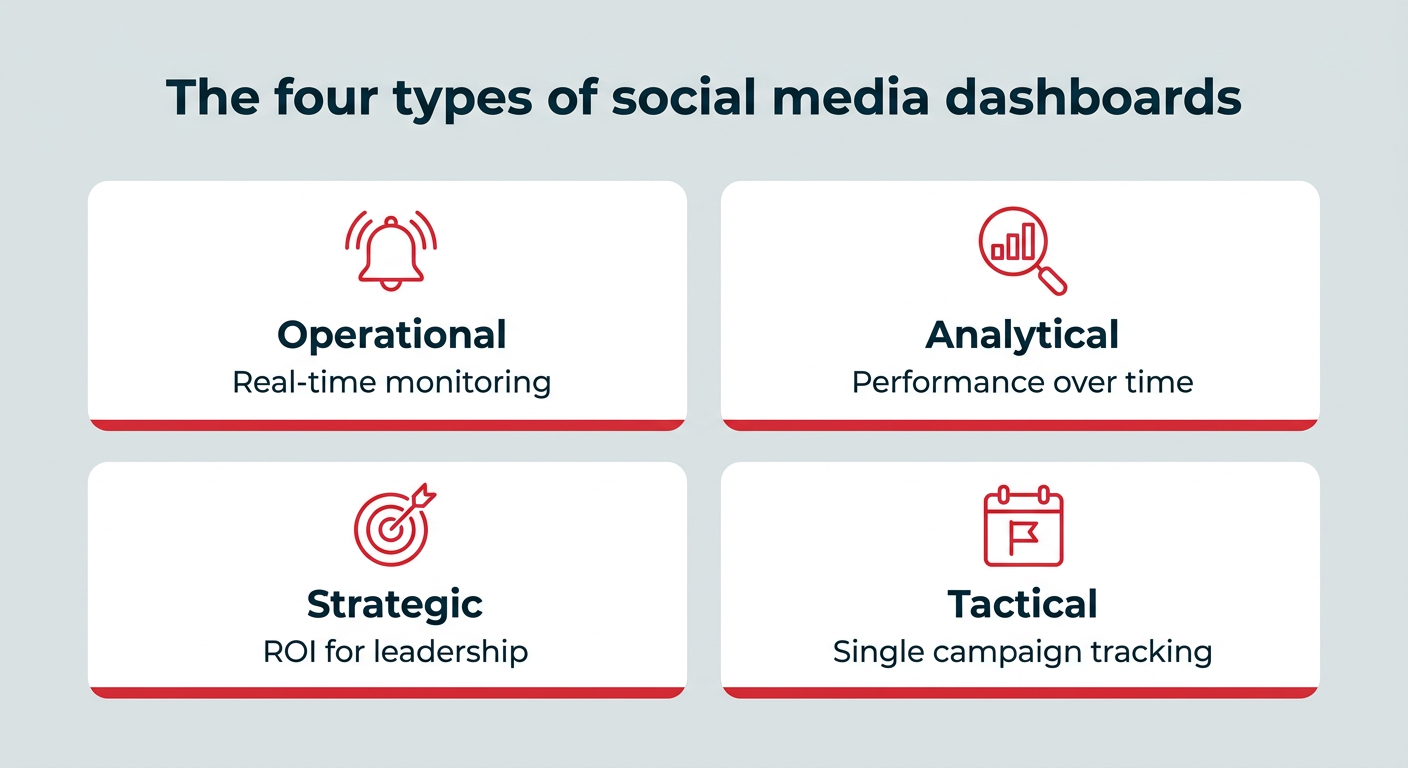
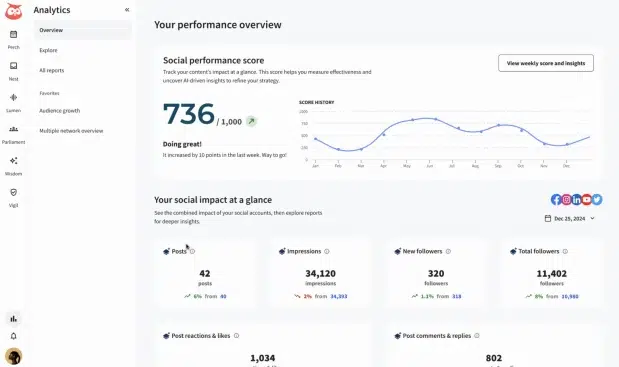
To prevent data overload and strategic fragmentation, modern marketing organizations categorize their dashboards based on specific operational objectives. Industry standards typically divide these tools into four distinct classifications: operational, analytical, strategic, and tactical. Operational dashboards are designed for social media coordinators and community care teams who must monitor real-time user activity, incoming mentions, and immediate customer service response needs. Analytical dashboards serve social media managers and data analysts who examine content trends and long-term audience performance over extended periods. Strategic dashboards target high-level decision-makers, including Chief Marketing Officers, Vice Presidents of Marketing, and regional directors, providing a macro-level view of return on investment (ROI) and progress toward overarching corporate objectives. Finally, tactical dashboards empower campaign managers and paid social specialists to track hyper-specific initiatives from launch to wrap. Aligning the dashboard architecture with the precise operational objective ensures that teams avoid cramming irrelevant metrics into a single view.
Solving the Enterprise Measurement and Reporting Burden

The necessity for sophisticated measurement tools has intensified as marketing budgets face strict scrutiny. According to recent industry surveys from Gartner, CMO marketing budgets have flatlined at approximately 7.8% of overall company revenue, with 59% of marketing leaders reporting insufficient financial resources to properly execute their overarching strategies. Furthermore, while approximately 15.3% of modern marketing budgets are allocated toward artificial intelligence initiatives, only 30% of enterprises feel fully prepared to scale those capabilities effectively. In this high-stakes environment, social media dashboards alleviate critical operational bottlenecks by drastically reducing the hours spent manually compiling monthly reports from native platform analytics. Instead of tedious data export routines, marketing teams can generate presentation-ready visualizations and data summaries in minutes. This reclaimed time is systematically reallocated toward high-value strategy formulation, content ideation, and campaign execution. Moreover, advanced dashboards leverage AI-powered insights to surface sudden anomalies, emerging consumer trends, and cross-channel patterns that human analysts might otherwise overlook when reviewing siloed data sets.
Mapping Performance Metrics to Strategic Business Goals
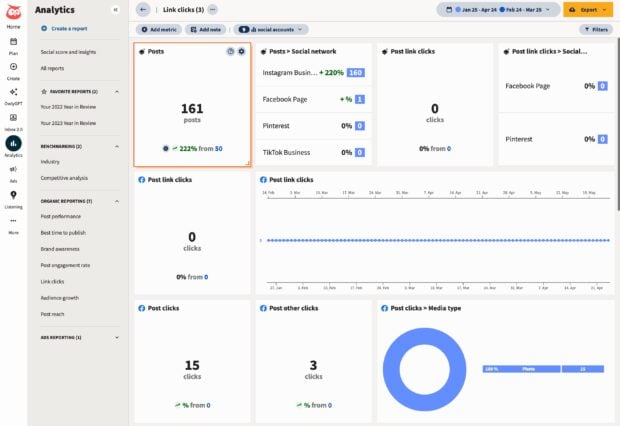
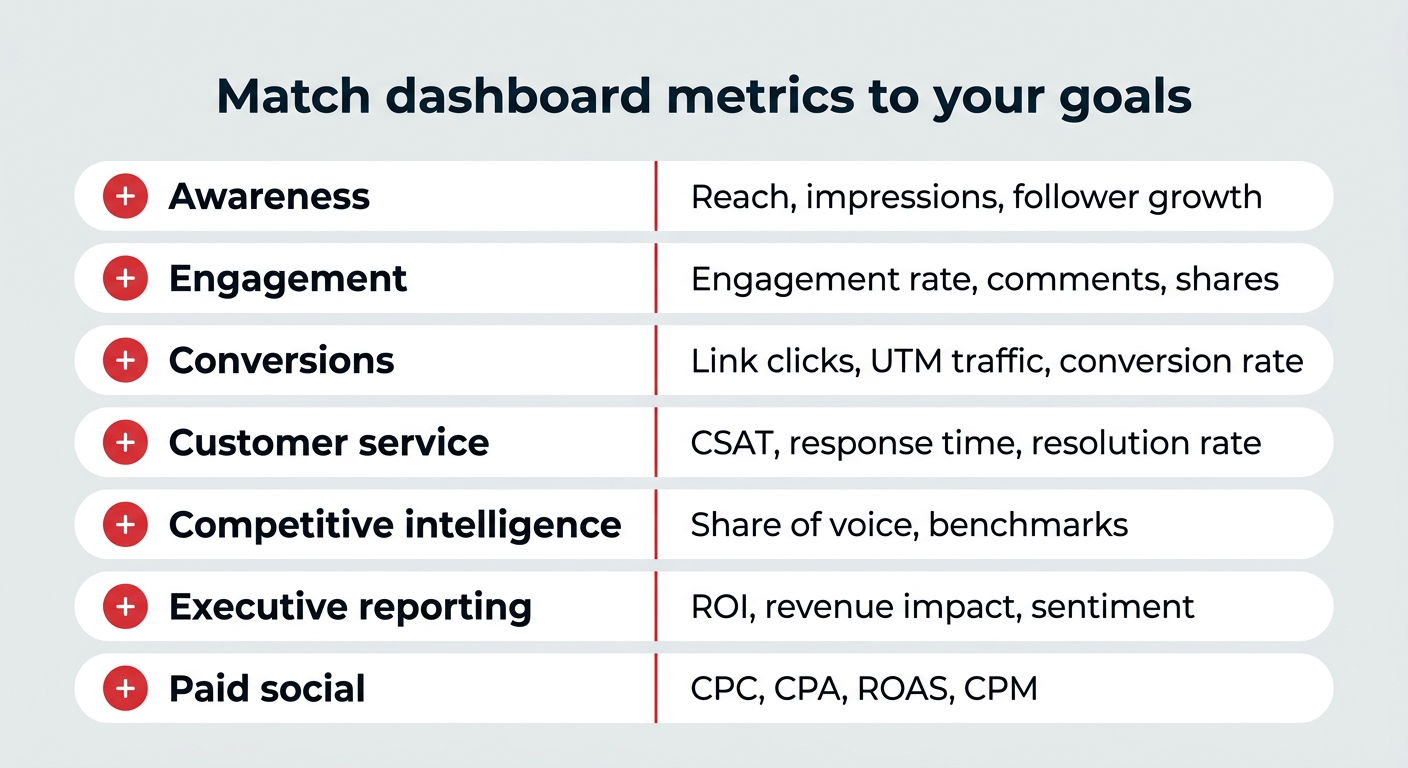
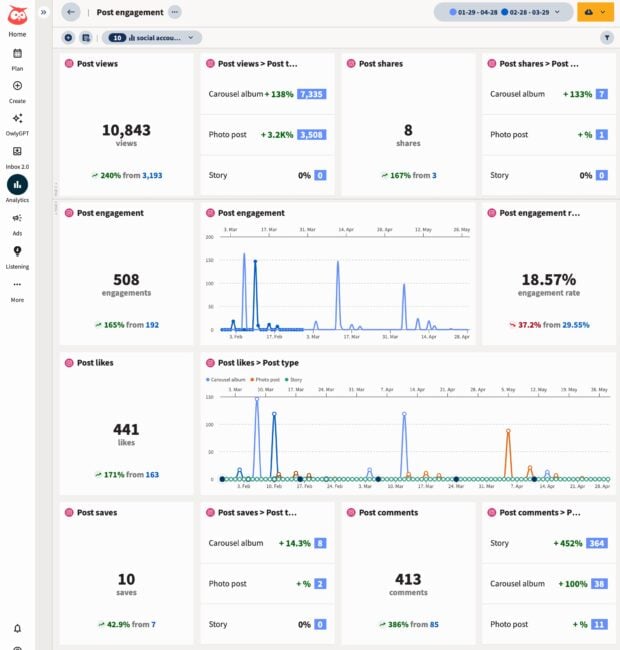
Establishing an effective analytics framework requires a rigorous alignment between key performance indicators and organizational goals. Tracking excessive, unvetted metrics frequently results in dashboard clutter and analytical paralysis. For brand awareness campaigns, essential metrics include total reach, gross impressions, and organic follower growth rates over time, which help enterprise teams measure the overarching footprint of major brand initiatives across diverse regional segments. Conversely, when focusing on content and engagement, organizations must monitor engagement rates, likes, comments, shares, and saves to gauge true audience resonance rather than relying solely on vanity metrics. For conversion-driven initiatives, tracking link clicks, UTM-parameterized traffic, and direct conversion rates provides a clear picture of downstream funnel activity, especially when integrated with customer relationship management (CRM) platforms and Google Analytics. Additional specialized dashboards—such as those dedicated to social listening, competitive intelligence, customer service, employee advocacy, and paid advertising—allow enterprises to monitor sentiment share of voice, customer satisfaction (CSAT) scores, response resolutions, cost-per-click (CPC), and return on ad spend (ROAS) with absolute precision.
Evaluating Top Dashboard Tools and Implementation Pathways
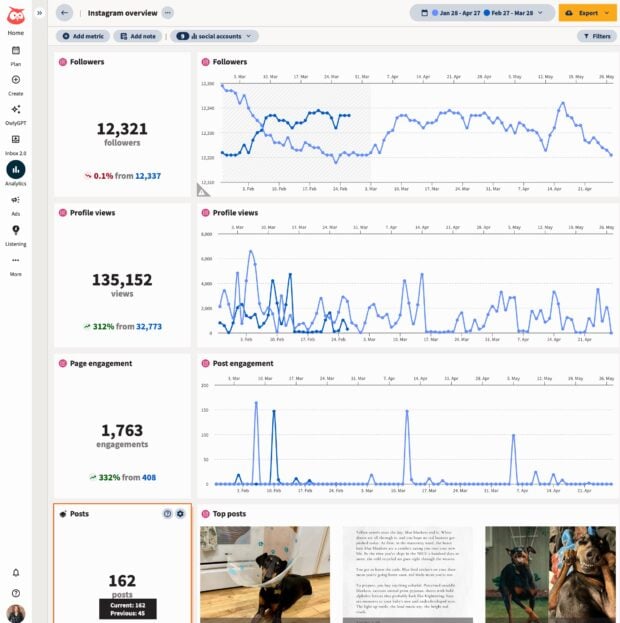
When establishing a social media analytics framework, organizations generally choose between two realistic pathways: deploying a fully integrated enterprise suite or building a customized, budget-conscious solution from scratch. Integrated systems like Hootsuite Social OS offer pre-built cross-platform reporting templates, automated data synchronization, and embedded workflow apps—such as Lumen for social listening, Nest for customer care, and Parliament for employee advocacy—starting around $99 per user per month for standard tiers. Conversely, budget-conscious teams frequently turn to free, highly customizable environments like Google Looker Studio. Building a custom dashboard in Looker Studio requires logging into the platform, establishing a data source, entering organization details, authorizing connections to Google Analytics or third-party connectors, and manually positioning individual metrics from a library of over 400 potential data points. While Looker Studio provides granular layout control at zero initial financial cost, it demands substantial manual setup and ongoing maintenance to adjust for constant social platform API updates. Alternative reporting specialists such as Klipfolio, Databox, DashThis, and Whatagraph offer specialized strengths ranging from automated white-labeled client reporting for marketing agencies to granular metric formula customization for advanced data analysts. Ultimately, the selection of a dashboard tool must be dictated by team size, the volume of managed networks, and the critical requirement for seamless integration between reporting, publishing, and engagement workflows.