Share of Voice Emerges as a Critical Metric for Navigating Fragmented Digital Visibility in the AI Era


Traditional analytics dashboards, while adept at tracking clicks and immediate website interactions, increasingly fail to provide a holistic view of a brand’s true market presence. The evolving digital landscape, particularly the rapid integration of artificial intelligence into search and information discovery, has rendered conventional traffic metrics incomplete. When potential customers encounter a competitor’s product mentioned in an AI-generated answer or scroll through a community forum where a brand is conspicuously absent, this represents a significant loss of visibility that simply does not register in standard traffic data. This phenomenon underscores the critical rise of Share of Voice (SoV) as an indispensable key performance indicator for brands seeking to understand and dominate their market.

Understanding Share of Voice in the Modern Digital Ecosystem
Share of Voice quantifies a brand’s relative visibility compared to its competitors across all pertinent channels where buyers conduct research and ultimately make purchasing decisions. While SoV historically tracked advertising expenditure as a proxy for market presence, its modern interpretation is far more expansive, encompassing organic search, AI search, social media mentions, public relations coverage, review platforms, and online communities. In essence, SoV measures the percentage of the overall conversation a brand owns within its specific category, offering a clearer picture of its influence and reach.
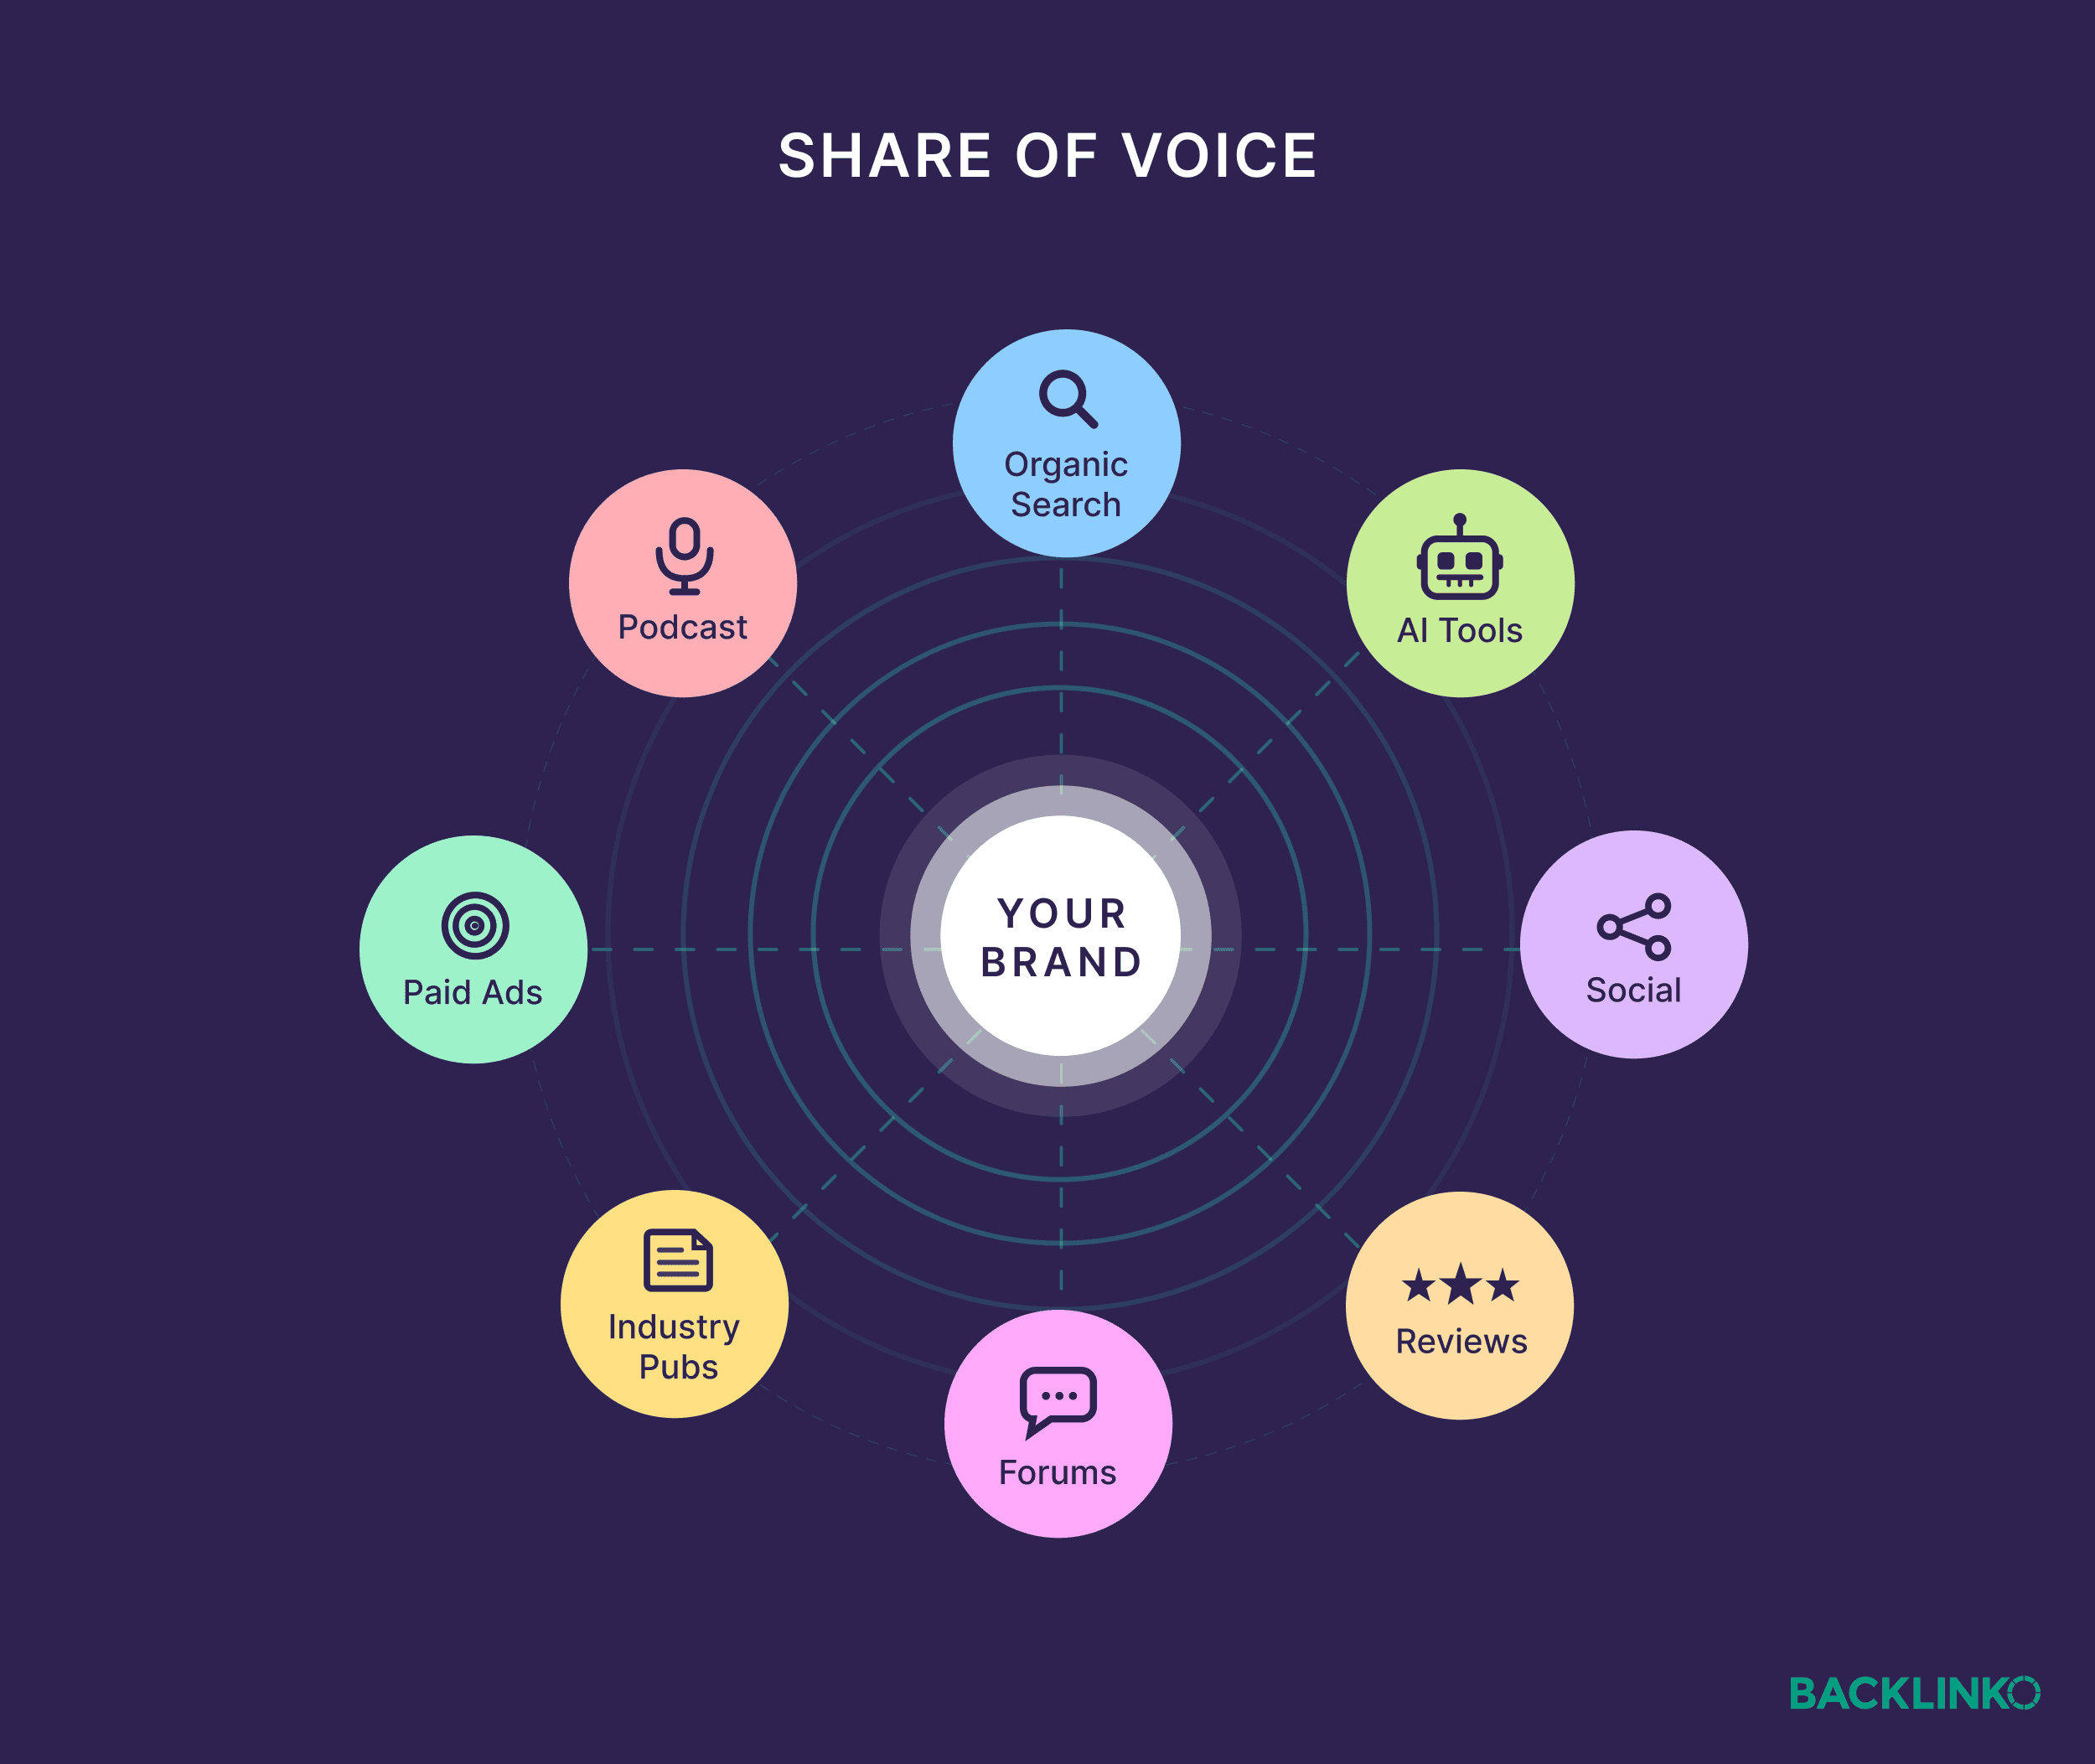
The current emphasis on SoV, particularly within search (both organic and AI-driven), stems from its ability to capture buyer intent at its strongest and its relative ease of competitive measurement. This guide delves into a four-step methodology for calculating SoV in this critical dual-search environment and translating those insights into actionable strategies that yield tangible business results.
The Shifting Digital Landscape: Why SoV Matters More Than Ever
The imperative for adopting SoV as a core metric is amplified by several profound shifts in how consumers discover information and interact with brands online.
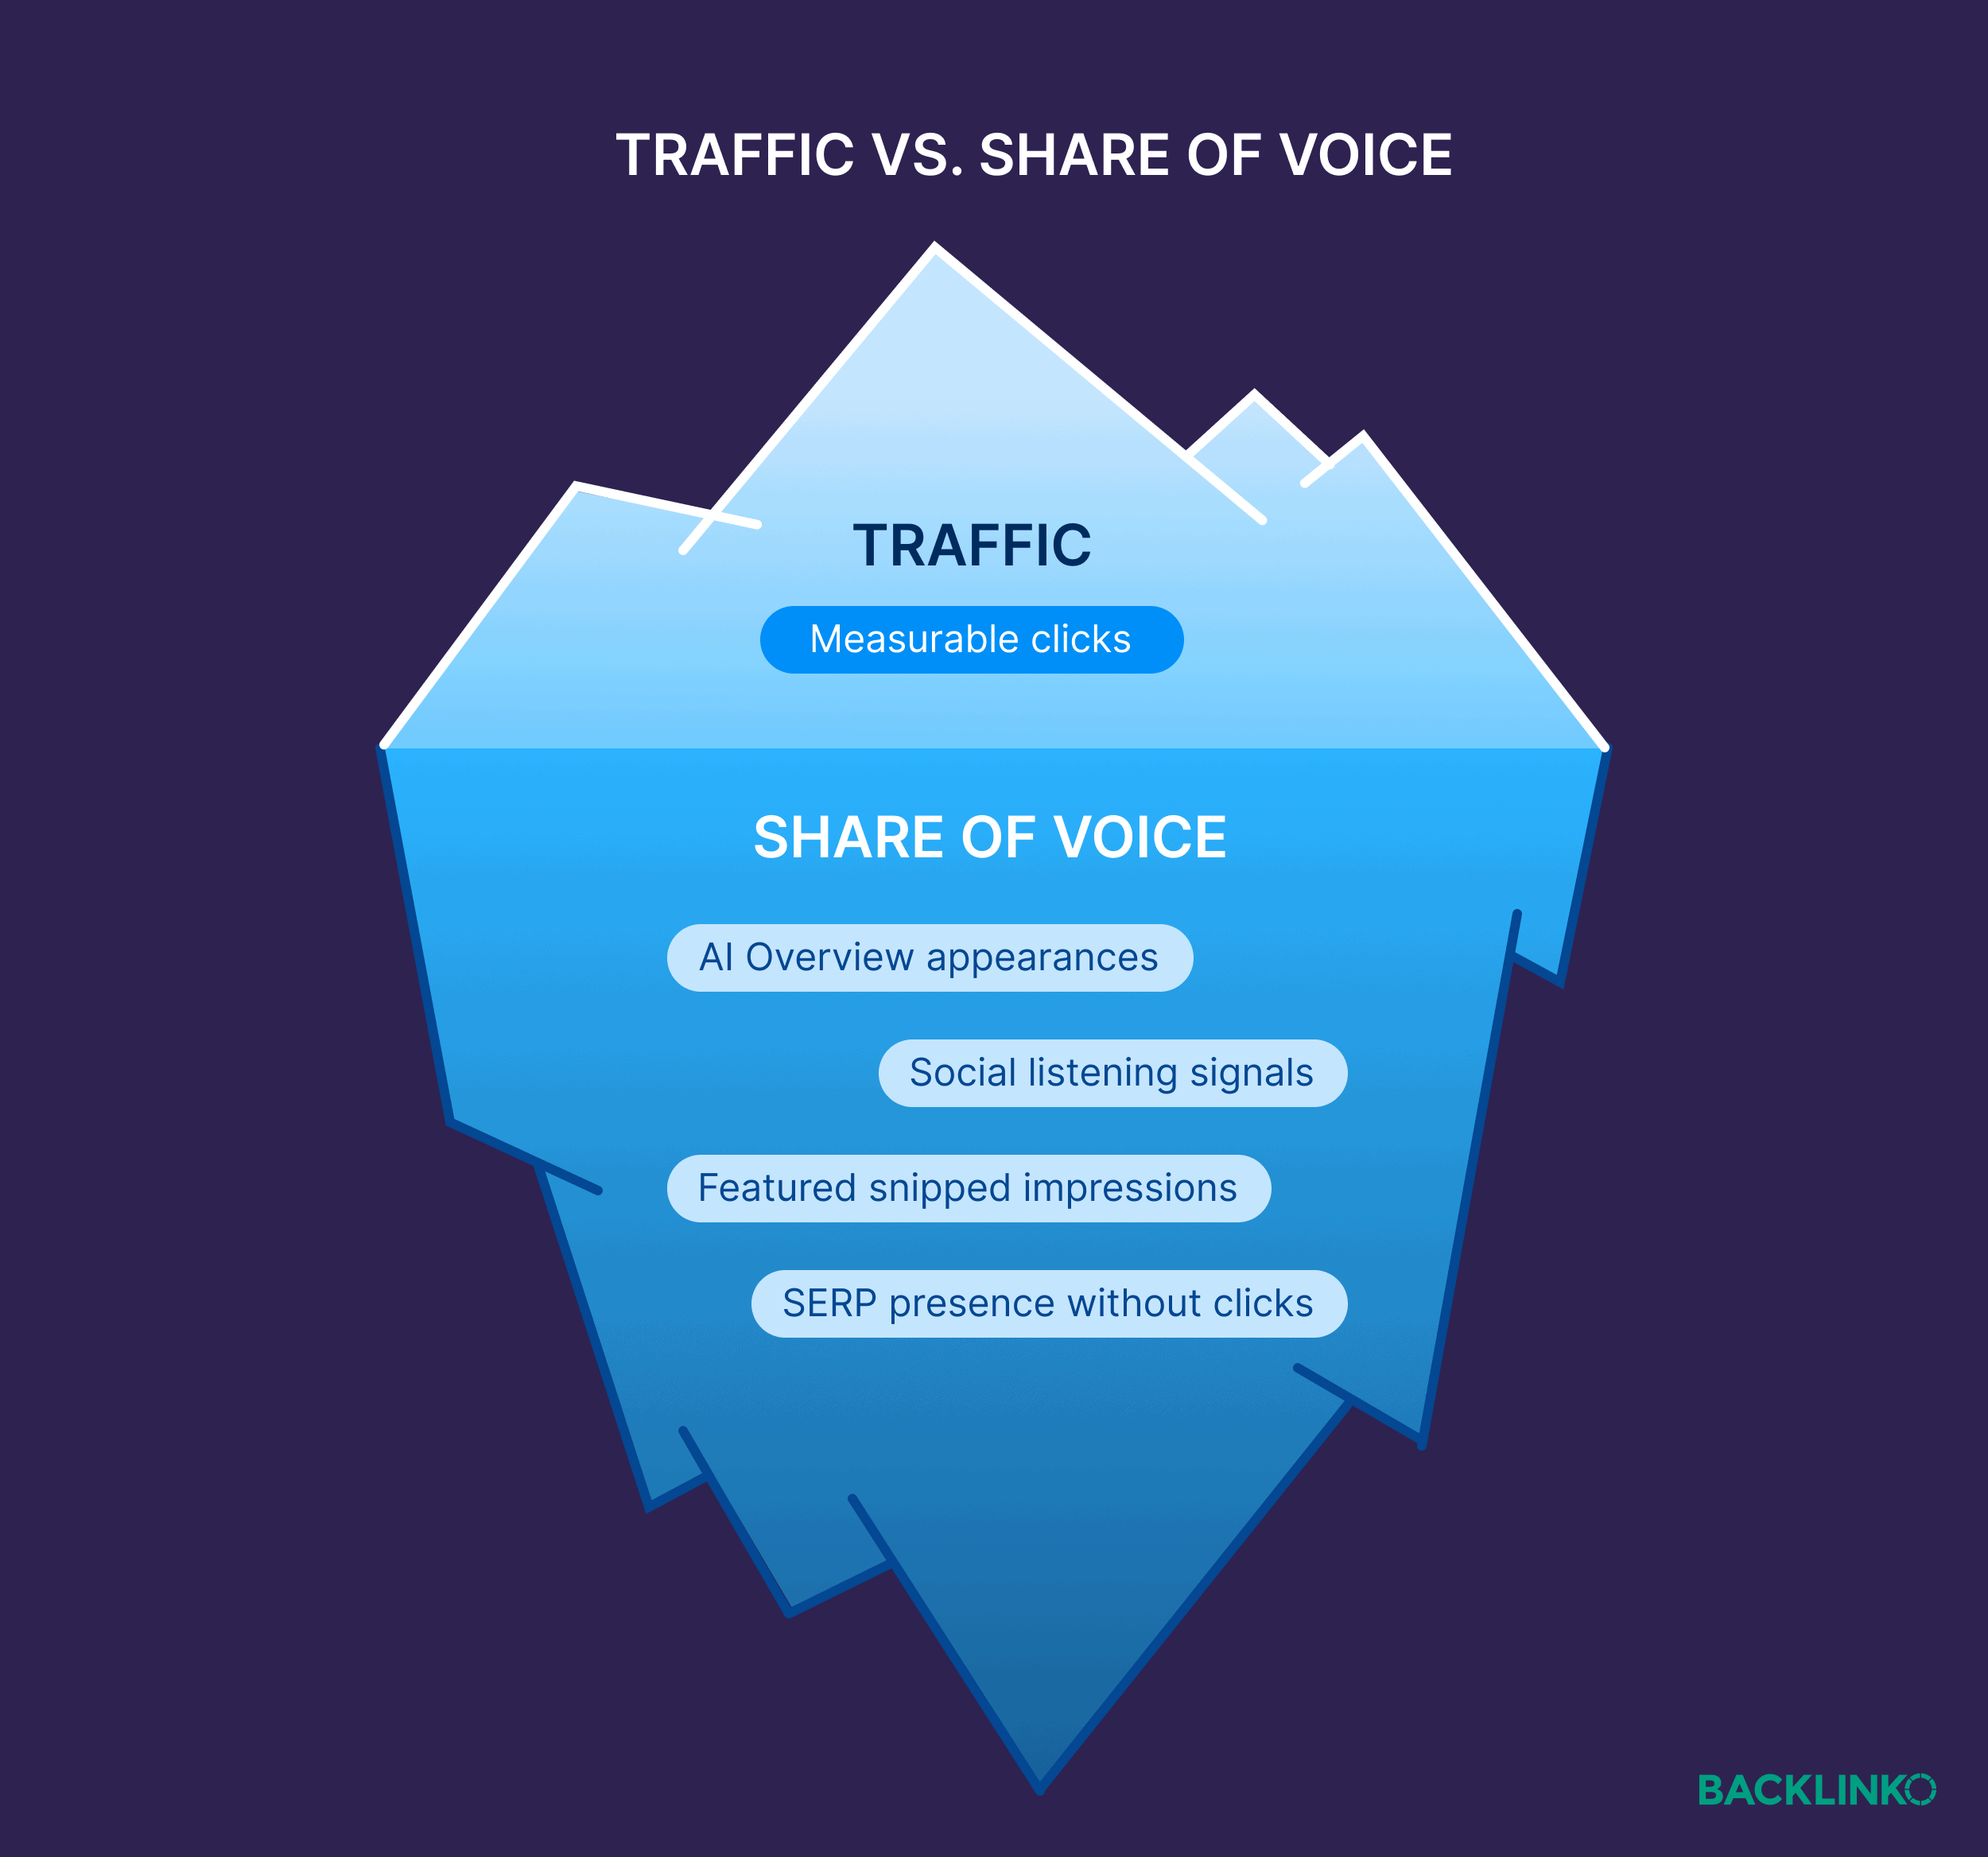
Tracking Visibility Beyond Traditional Traffic Data
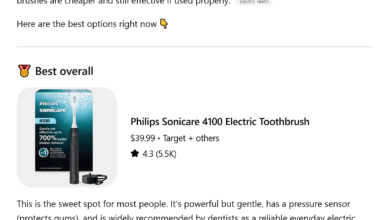
Organic traffic data, once the gold standard, now paints only a partial picture. The proliferation of "zero-click searches" – where users find answers directly within search engine results pages (SERPs) or AI Overviews without ever visiting a website – means a substantial portion of brand visibility goes unrecorded by tools like Google Analytics. Industry reports indicate that zero-click searches now account for approximately 65% of all Google queries, a figure that continues to climb with the mainstreaming of generative AI. This makes traditional traffic a lagging indicator, capturing only the direct engagement, not the initial awareness or consideration.
SoV, conversely, acts as a proactive measure, revealing a brand’s presence within the buyer’s consideration set, even when no direct click occurs. Consider a scenario: A user queries "best project management software for creative agencies." An AI Overview lists five top tools, including Brand X. The user absorbs this information, refrains from clicking any link, and later navigates directly to Brand X’s website to request a demo. Traditional analytics would log this as "direct traffic," failing to credit the crucial initial discovery via AI. SoV, however, would accurately reflect Brand X’s appearance in the consideration set for a high-intent query, providing valuable insight into its pre-click influence.
Unifying Marketing Efforts with SoV as a North Star
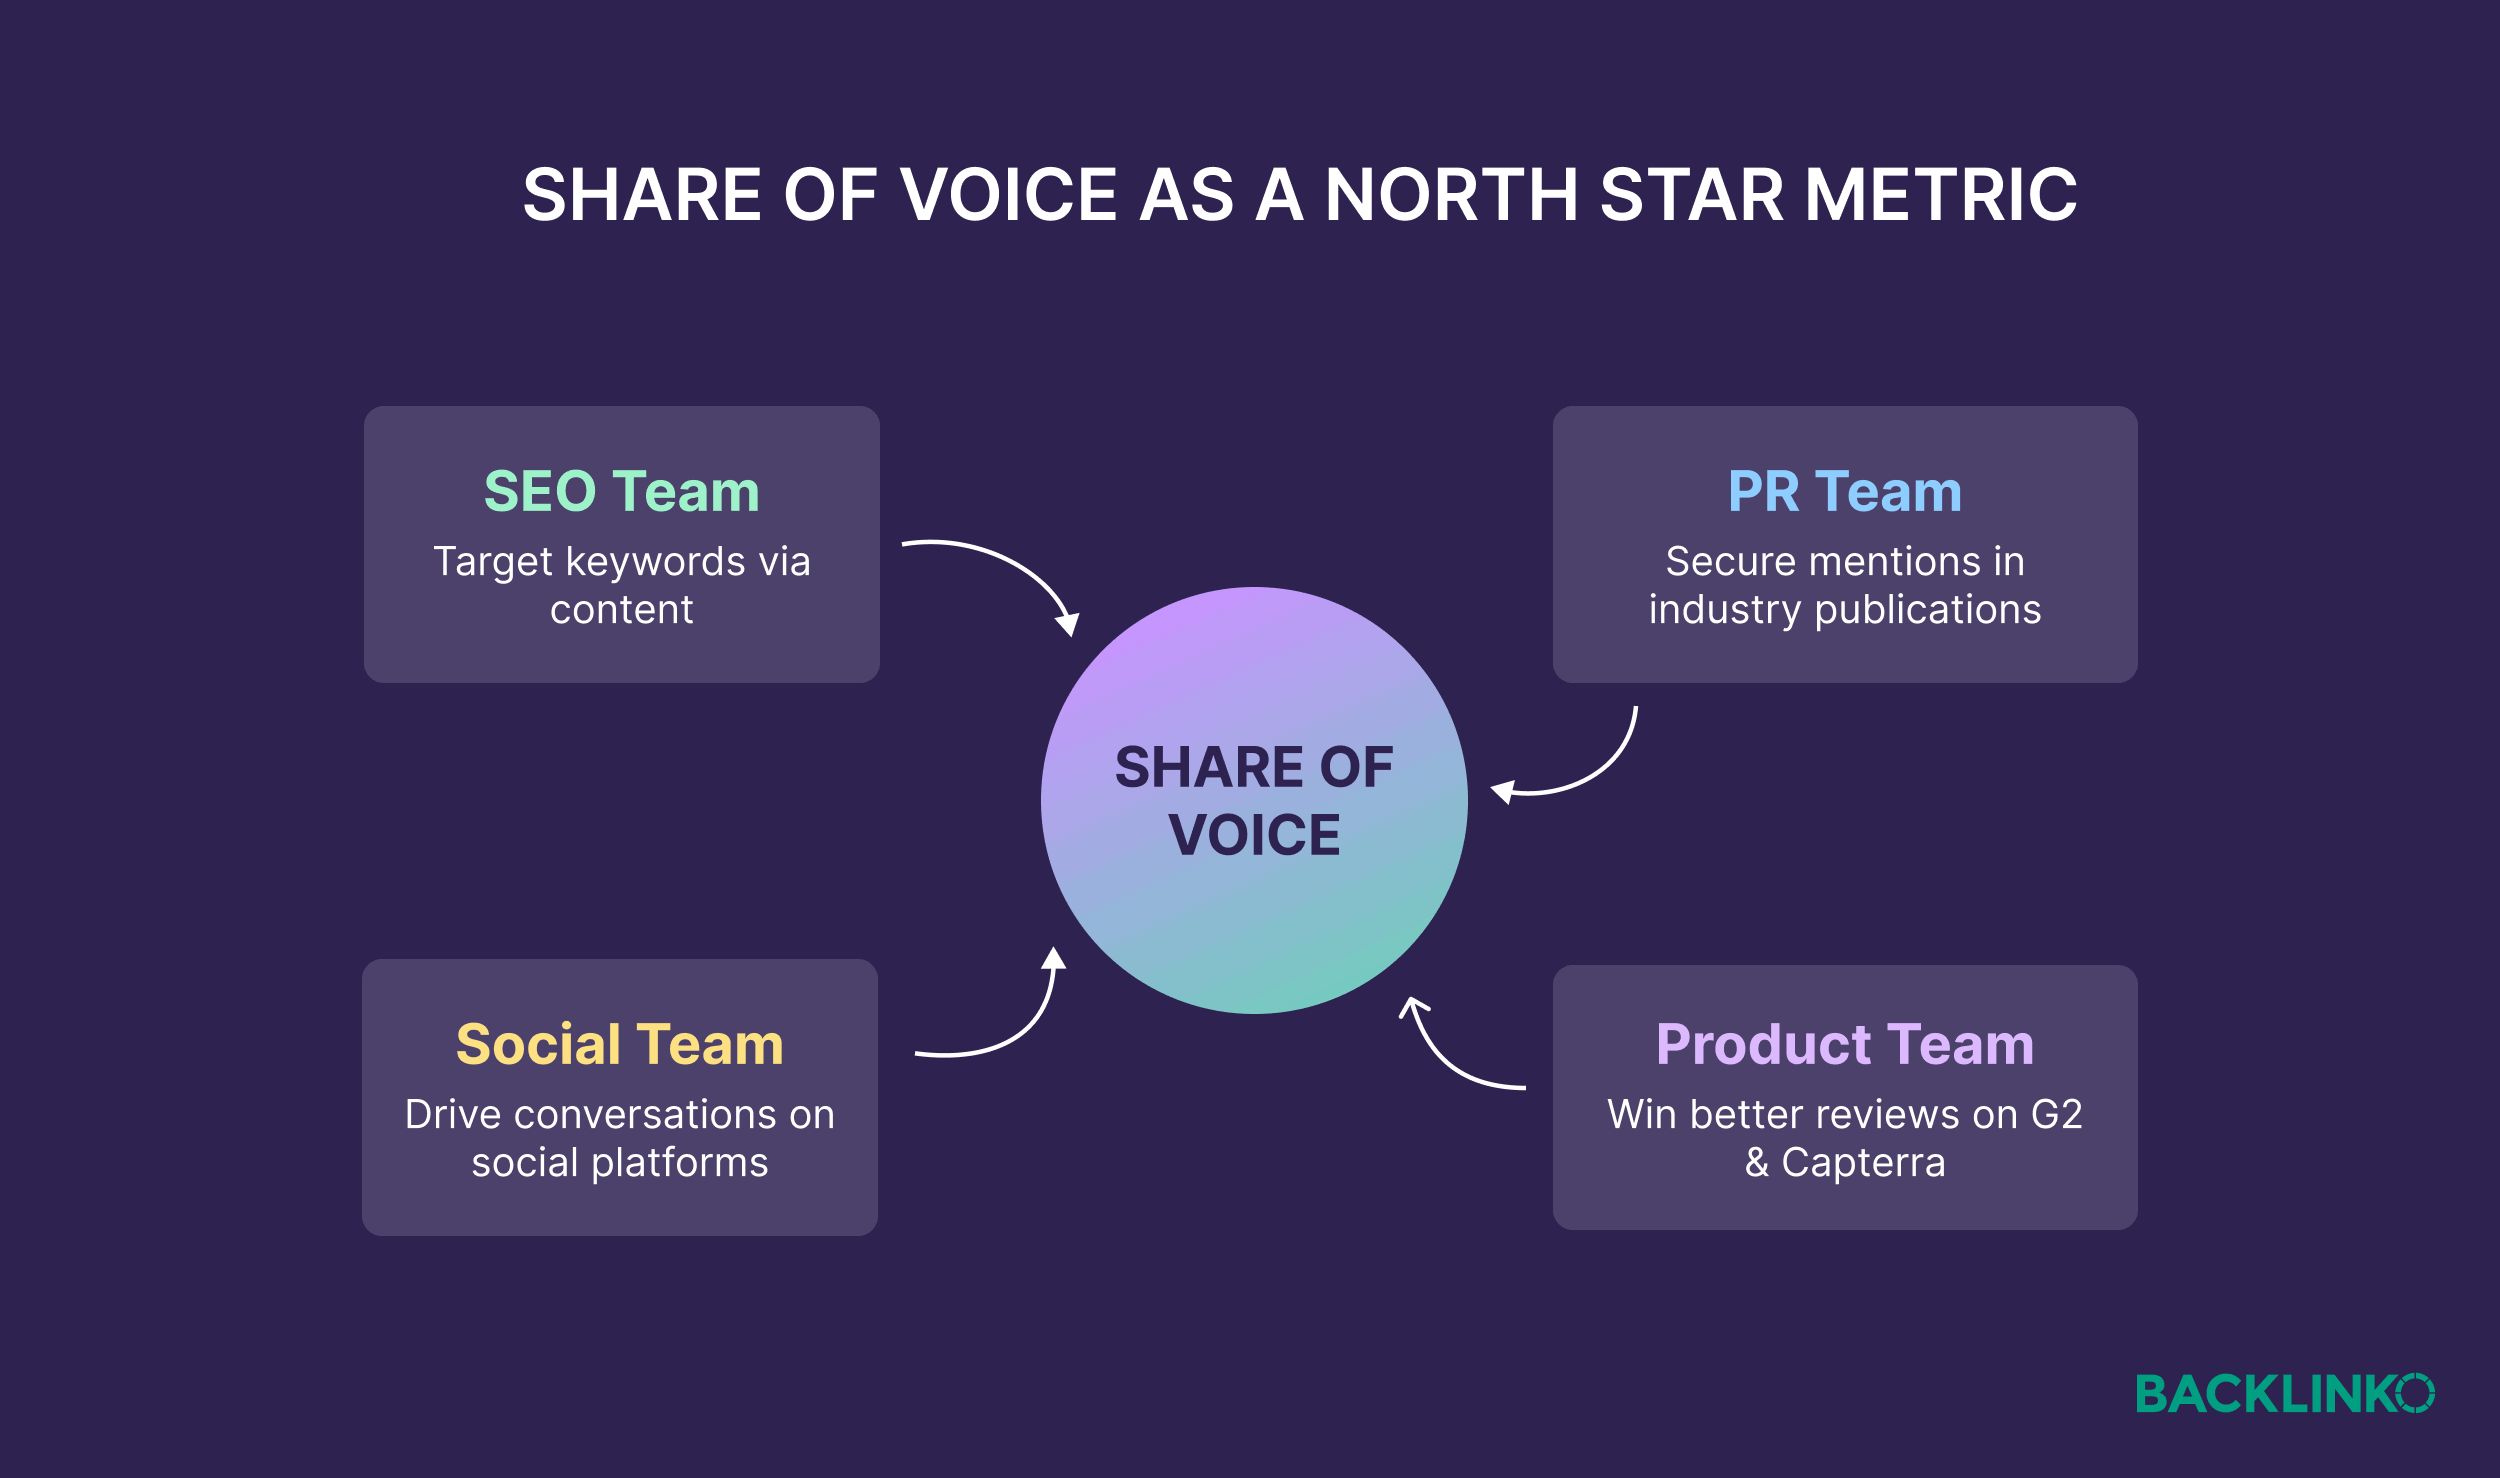
A common challenge in large organizations is marketing team fragmentation. SEO teams prioritize website visits, PR departments chase media mentions, and social media managers focus on engagement metrics. Each operates within its own silo, optimizing for disparate key performance indicators (KPIs). SoV offers a powerful solution by providing a single, unifying "North Star" metric around which all marketing efforts can coalesce.
When every team understands how their contributions impact the collective SoV percentage, it fosters unprecedented collaboration and strategic alignment. For instance, the SEO team might focus on optimizing content for featured snippets and AI Overviews, while the PR team targets credible publications likely to be cited by Large Language Models (LLMs). The social media team could monitor discussions to identify emerging conversational prompts for AI. This integrated approach ensures that all efforts contribute to a shared goal of maximizing brand visibility across the entire buyer journey. According to Sarah Chen, a leading digital marketing consultant, "The beauty of SoV is its ability to transcend departmental boundaries, offering a universal language for brand impact that resonates from content creators to the C-suite."
The Evolution of SoV Measurement: Traditional vs. AI Search
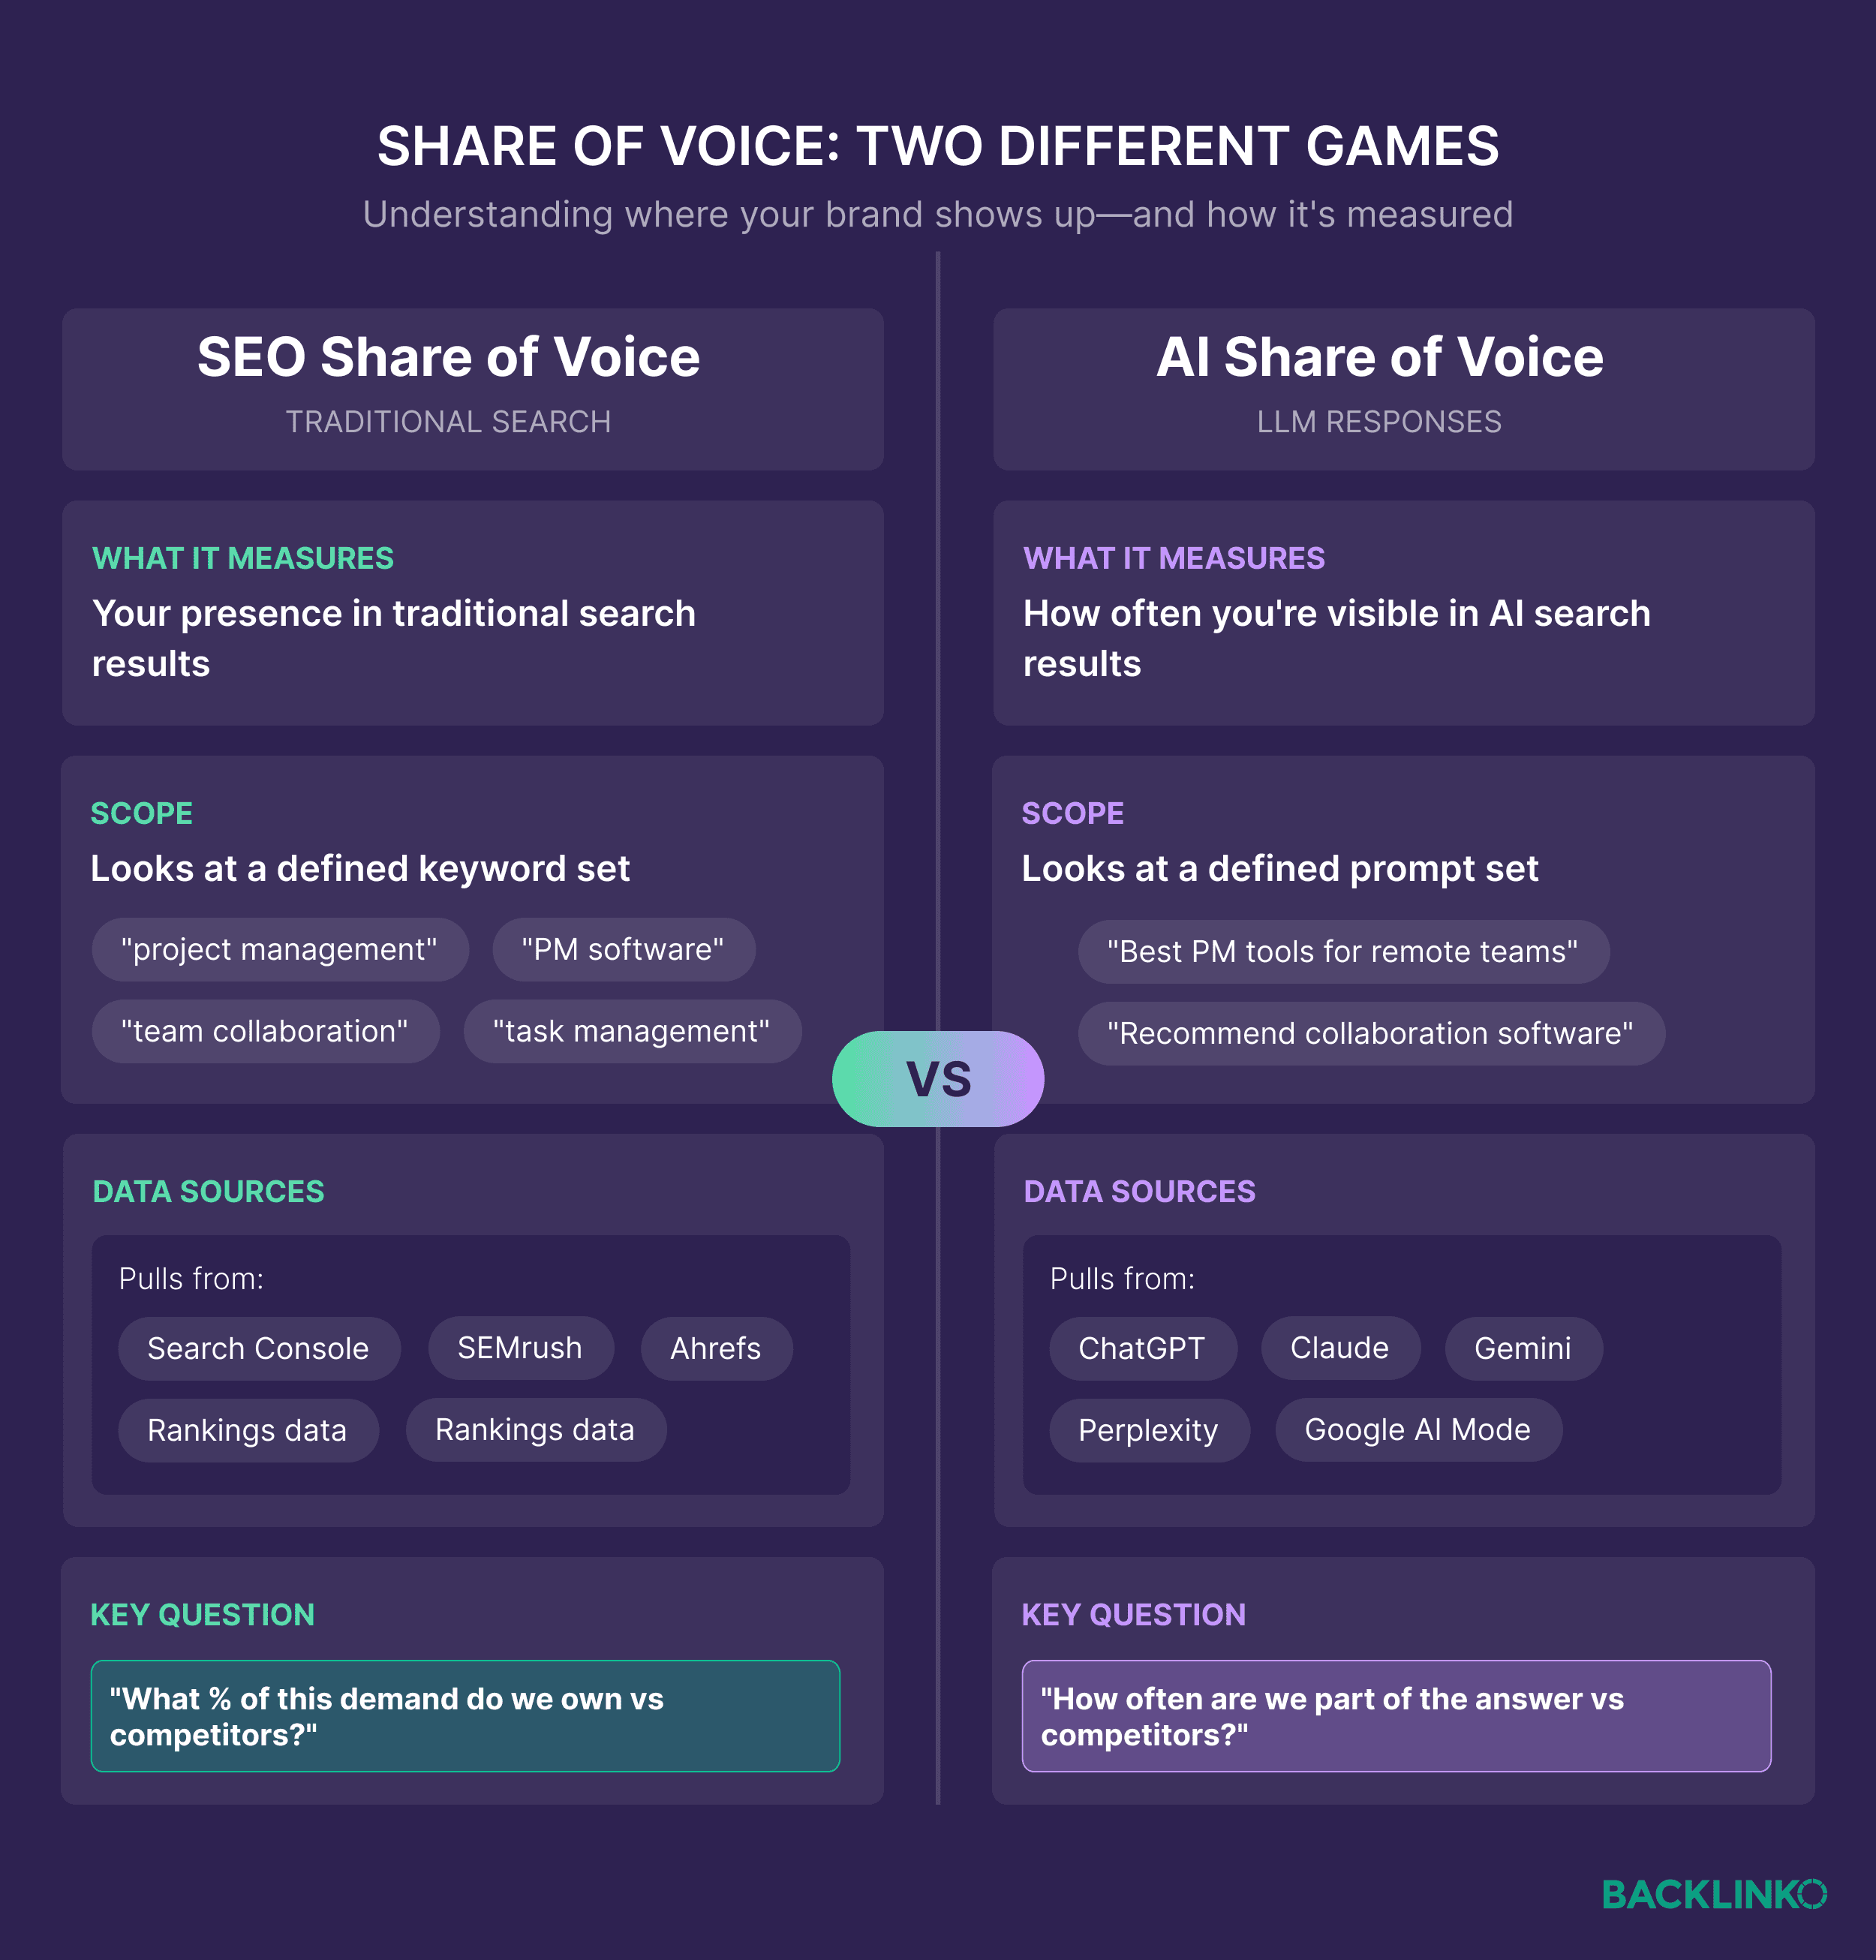
While both SEO SoV and AI SoV aim to answer the fundamental question – "What percentage of category demand does your brand own?" – they operate within distinct search contexts.
SEO SoV traditionally calculates a brand’s slice of organic search traffic. For example, if a brand tracks 100 target keywords that collectively generate 50,000 monthly visits across all ranking sites, and the brand captures 15,000 of those visits, its organic share of voice is 30%. This relies on keyword rankings, estimated click-through rates (CTR), and overall search volume.
AI SoV, a newer but rapidly evolving metric, measures brand mentions and citations within LLM responses from platforms like ChatGPT, Perplexity, and Google AI Mode. If a brand tests 100 category-related prompts and its brand is mentioned in 45 responses and cited as a source in 15, while a competitor appears in 30 responses with 10 citations, an AI visibility tool can calculate a weighted AI SoV based on the frequency and prominence of these mentions and citations. This distinction is crucial as LLMs prioritize different signals for inclusion and recommendation than traditional search algorithms.
This guide prioritizes search SoV—organic and AI—because it represents the fastest-shifting landscape for buyer discovery and where measurement tools are maturing rapidly enough to provide actionable insights. Understanding search SoV often forms the foundational layer upon which visibility in other channels can be more easily integrated and optimized.

How to Measure Share of Voice in 4 Strategic Steps
Accurately calculating SoV requires a structured approach. Using a fictional project management software company as an example, we illustrate how each step translates into valuable business insights.
Step 1: Defining Your Industry Landscape and Competitive Arena
The initial step involves meticulously outlining the specific competitors and keywords or prompts that will be tracked. Without clear boundaries, the data can either be too sparse to be meaningful or overwhelmingly noisy.
To map the competitive terrain effectively, brands should identify "topic clusters" directly tied to revenue generation. For a project management software, these clusters might include:
- "Project Management Methodologies" (e.g., Agile, Scrum, Waterfall)
- "Project Planning Tools" (e.g., Gantt charts, Kanban boards)
- "Collaboration Software Features" (e.g., team communication, file sharing)
- "Industry-Specific Project Management" (e.g., for marketing agencies, construction)
- "Project Management Software Comparisons" (e.g., Asana vs. Trello, alternatives to Monday.com)
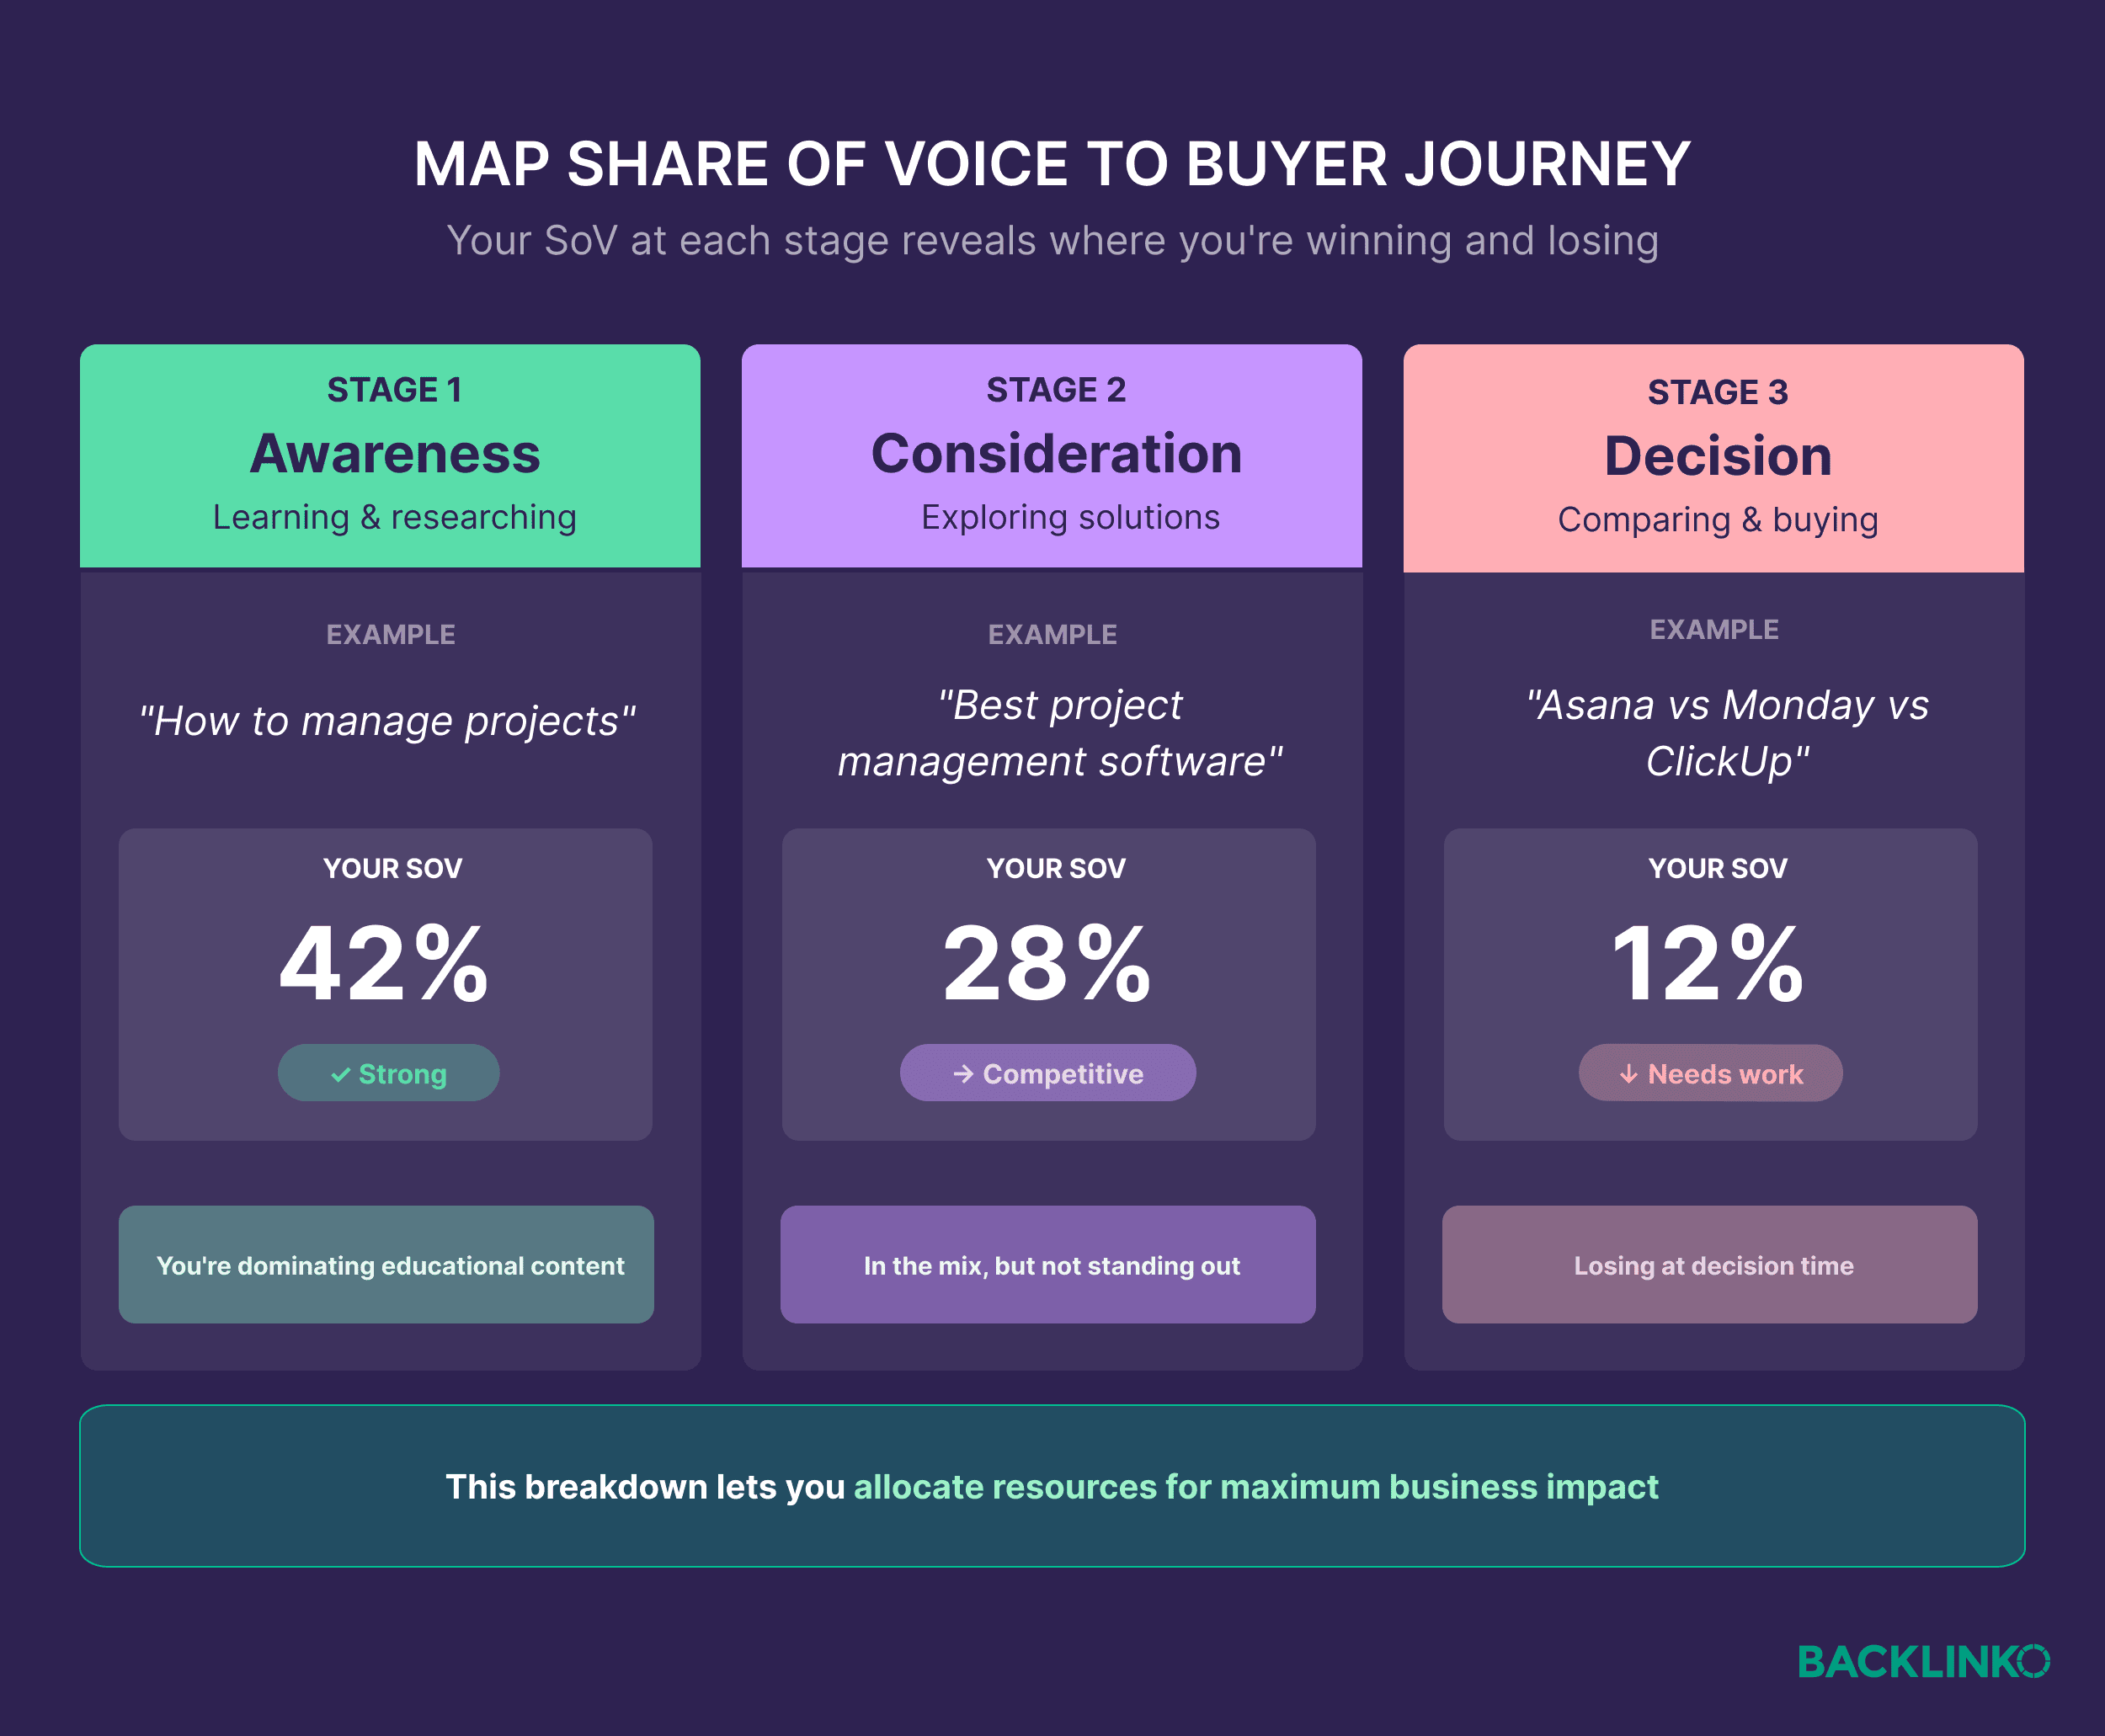
Categorizing these clusters by buyer journey stages — Awareness, Consideration, and Decision — allows for a granular understanding of where the brand is winning or losing.
- Awareness: Broad queries like "what is agile project management?"
- Consideration: Mid-funnel queries such as "best project management software for small teams."
- Decision: High-intent queries like "[Your Brand] vs. [Competitor]" or "alternatives to [Competitor]."
For our example project management software, an analysis might reveal strong SoV in "Awareness" but negligible presence in "Decision" stage queries. This indicates the brand is educating the market but failing to appear when prospects are actively evaluating solutions. The strategic takeaway would be to reallocate content resources to comparison pages, detailed feature breakdowns, and case studies to bolster decision-stage visibility.

Beyond self-assessment, it’s vital to define competitors:
- Direct Competitors: Brands offering similar products/services.
- Indirect Competitors: Information providers (e.g., industry blogs, review sites, niche communities) that capture significant visibility for relevant queries.
Tracking both ensures a comprehensive view of who controls the conversation and where breakthrough opportunities lie.
Step 2: Building Comprehensive Keyword & Prompt Libraries
A robust library of 200-500 queries is essential to accurately capture how potential buyers search in a given category. This library must encompass both traditional keywords and conversational AI prompts.

Pulling SEO Data
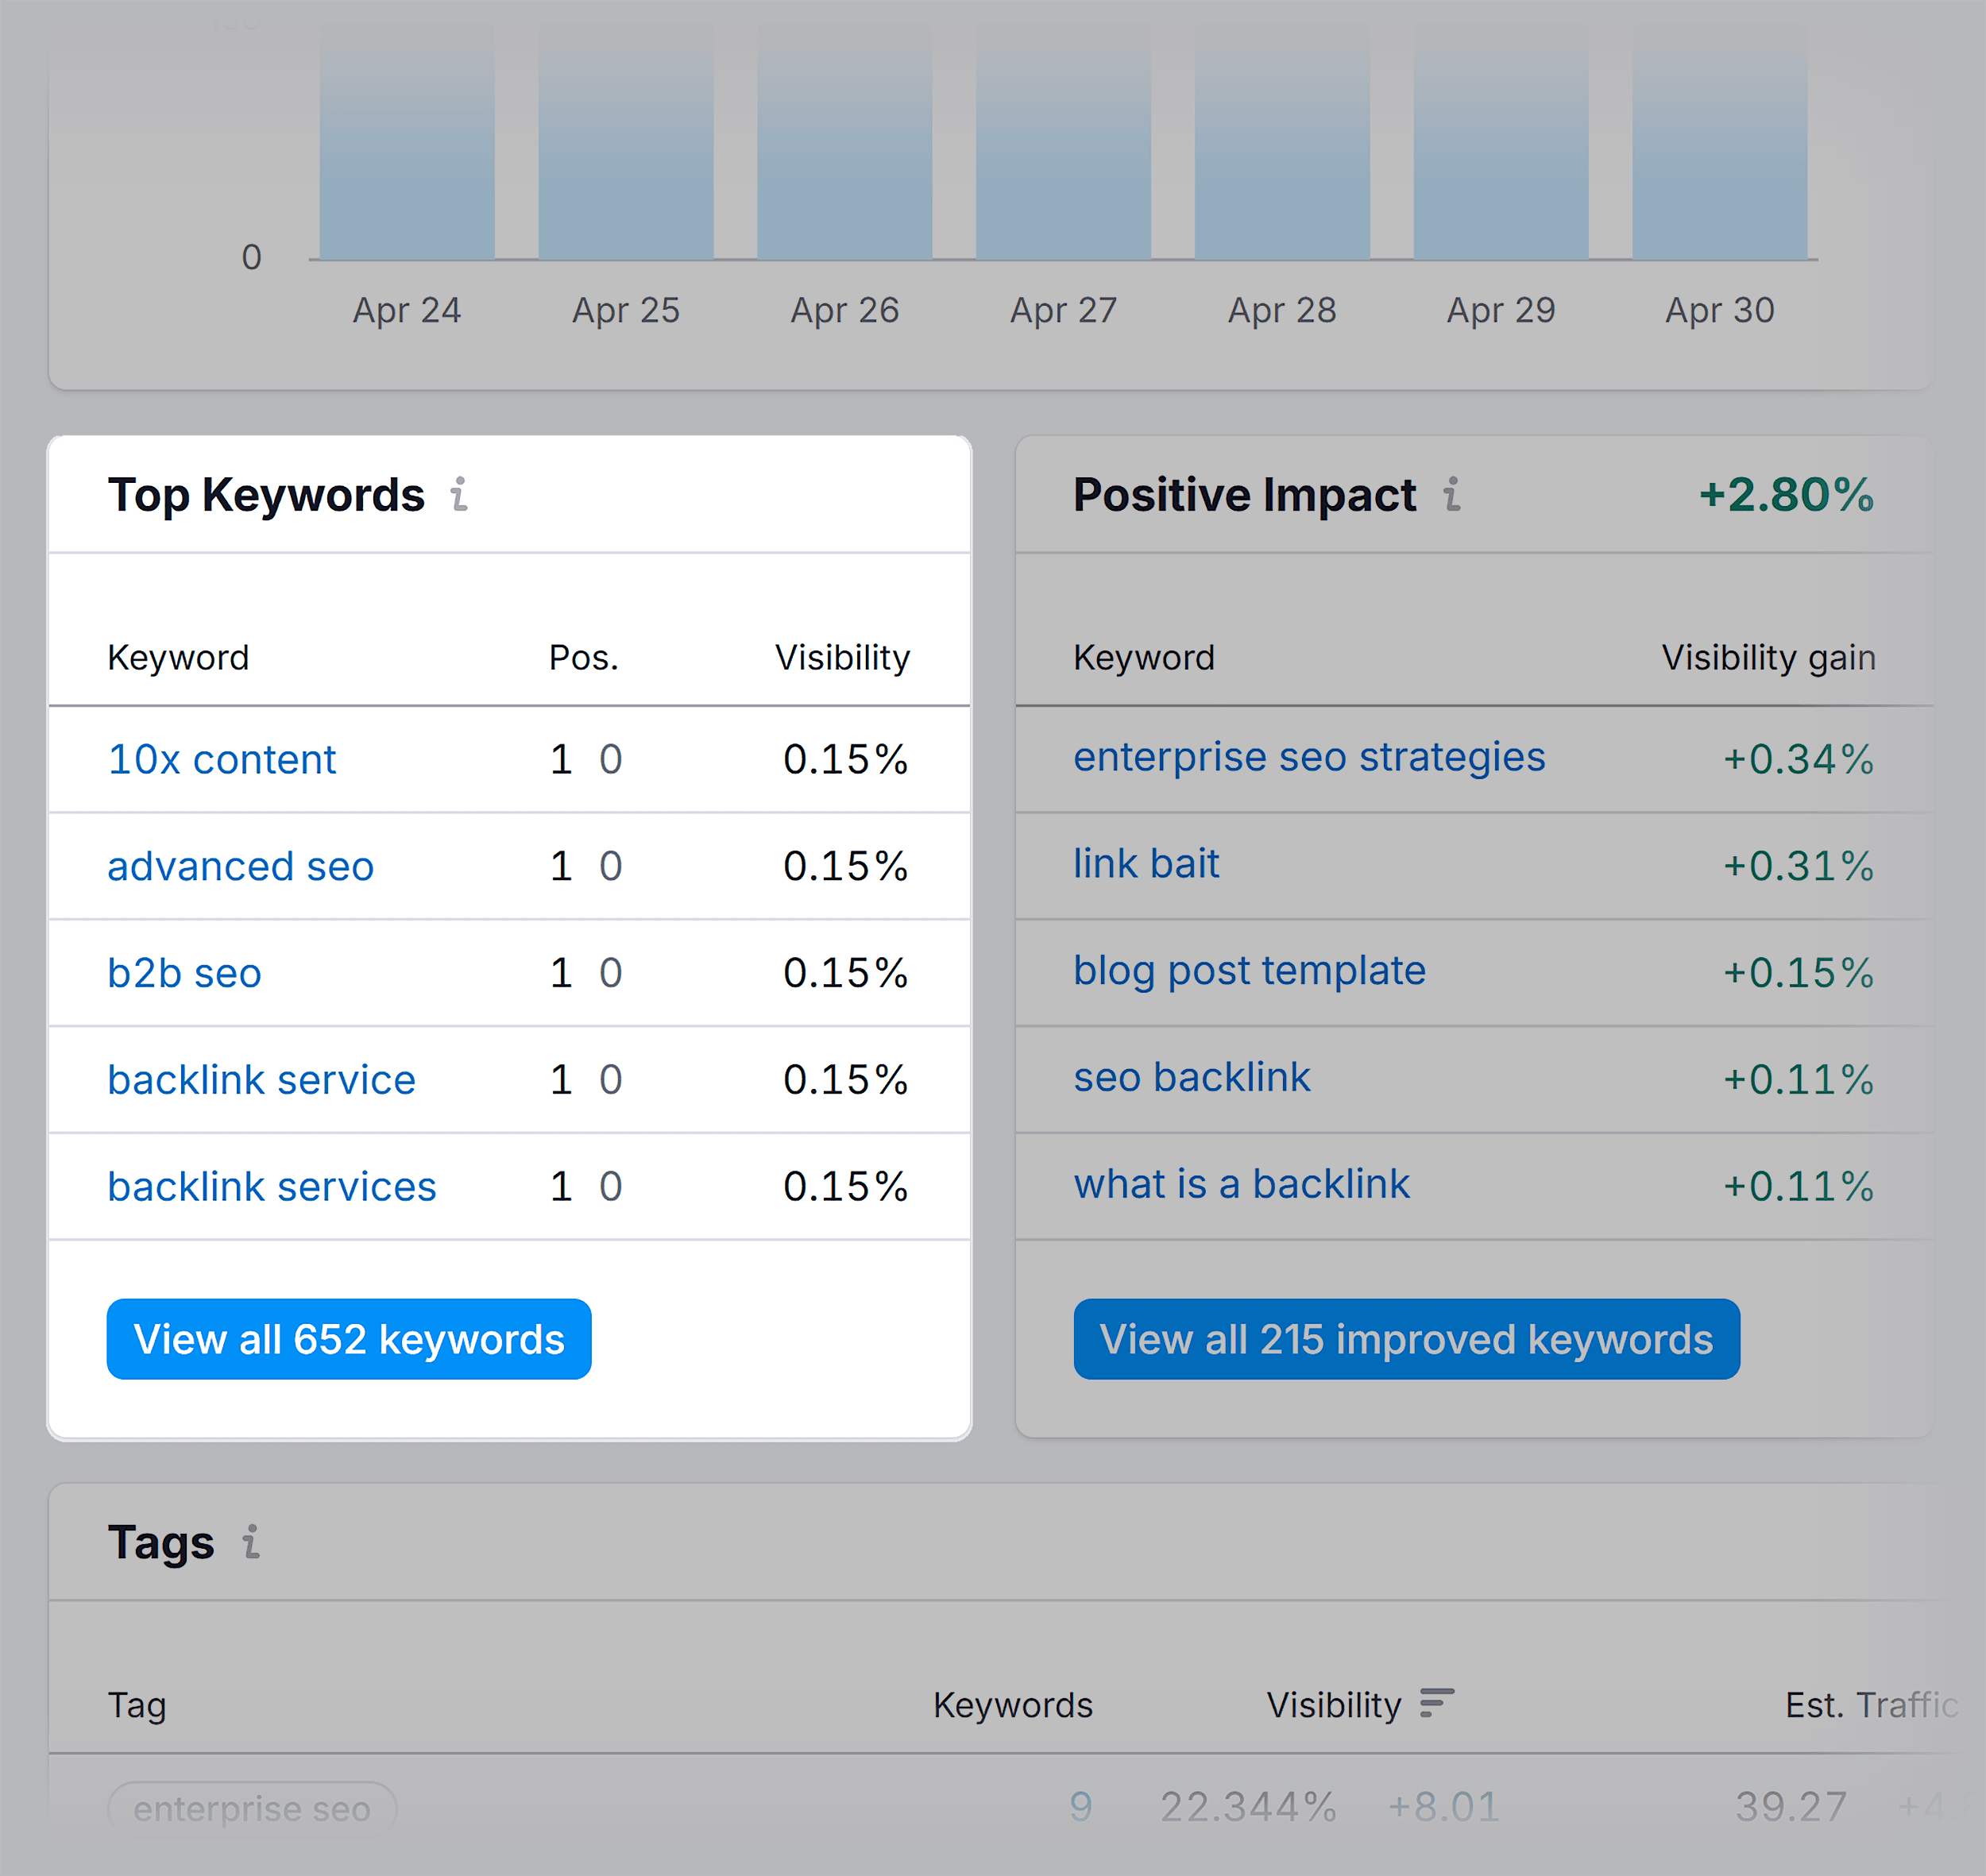
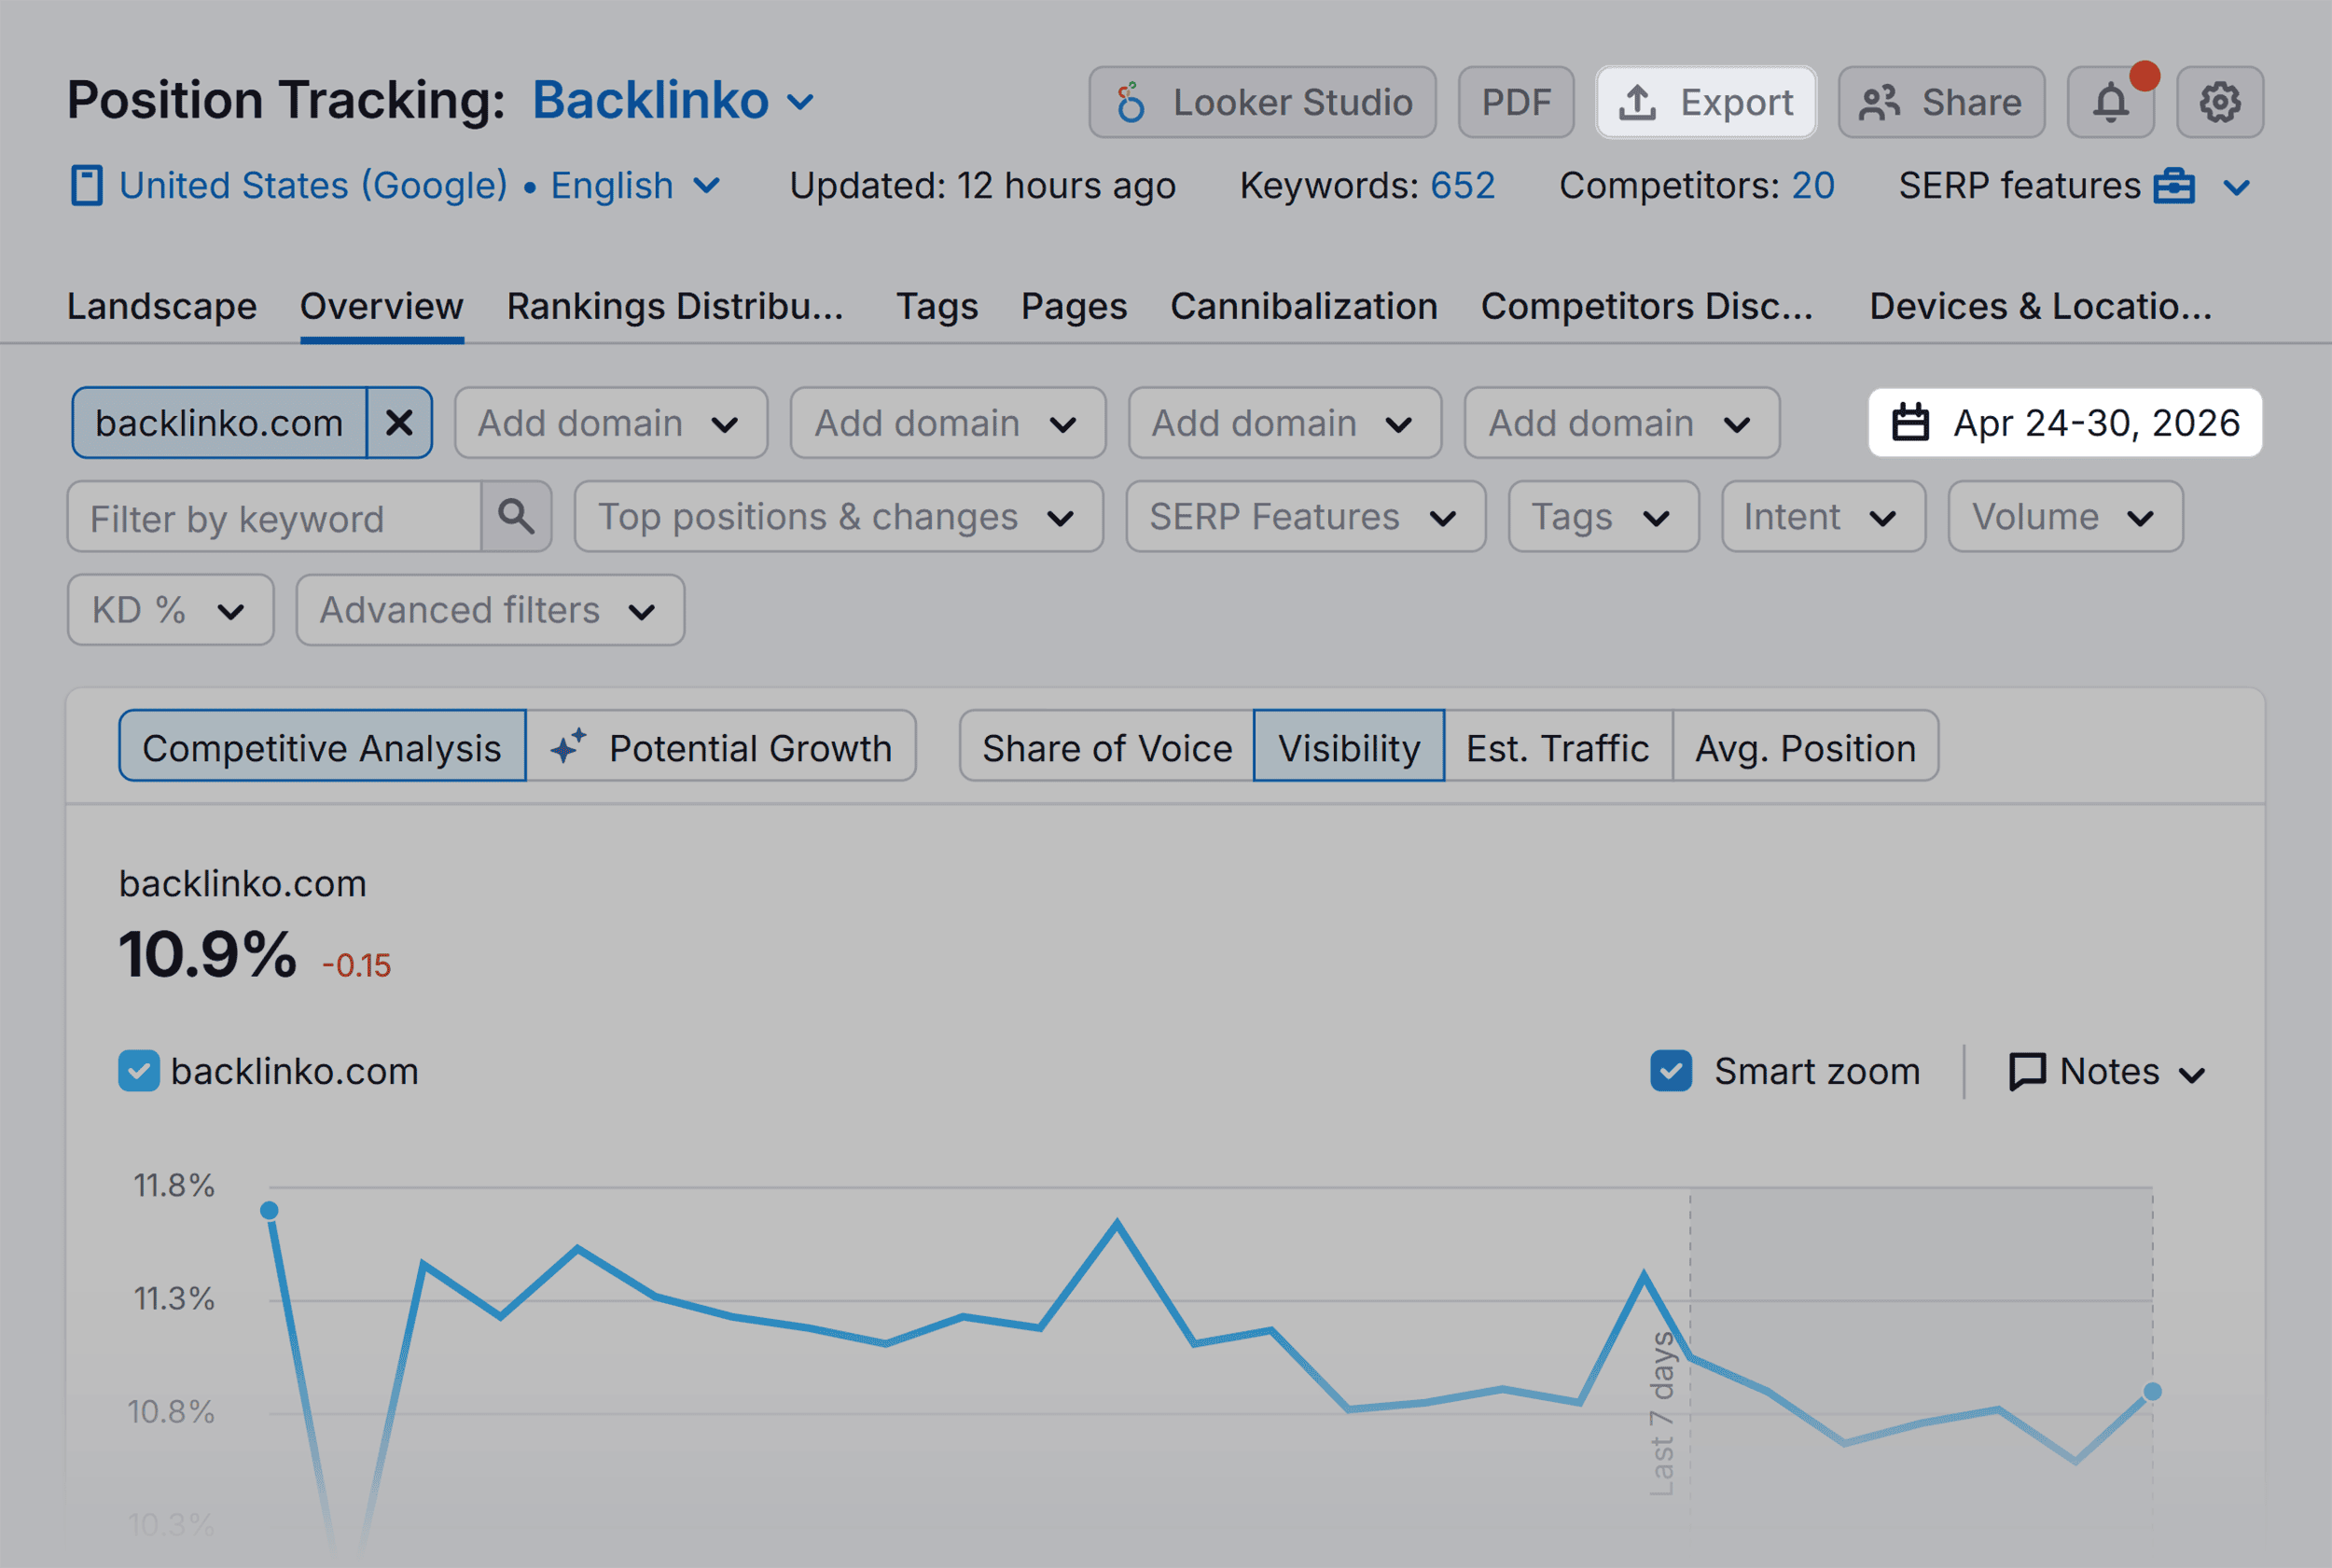
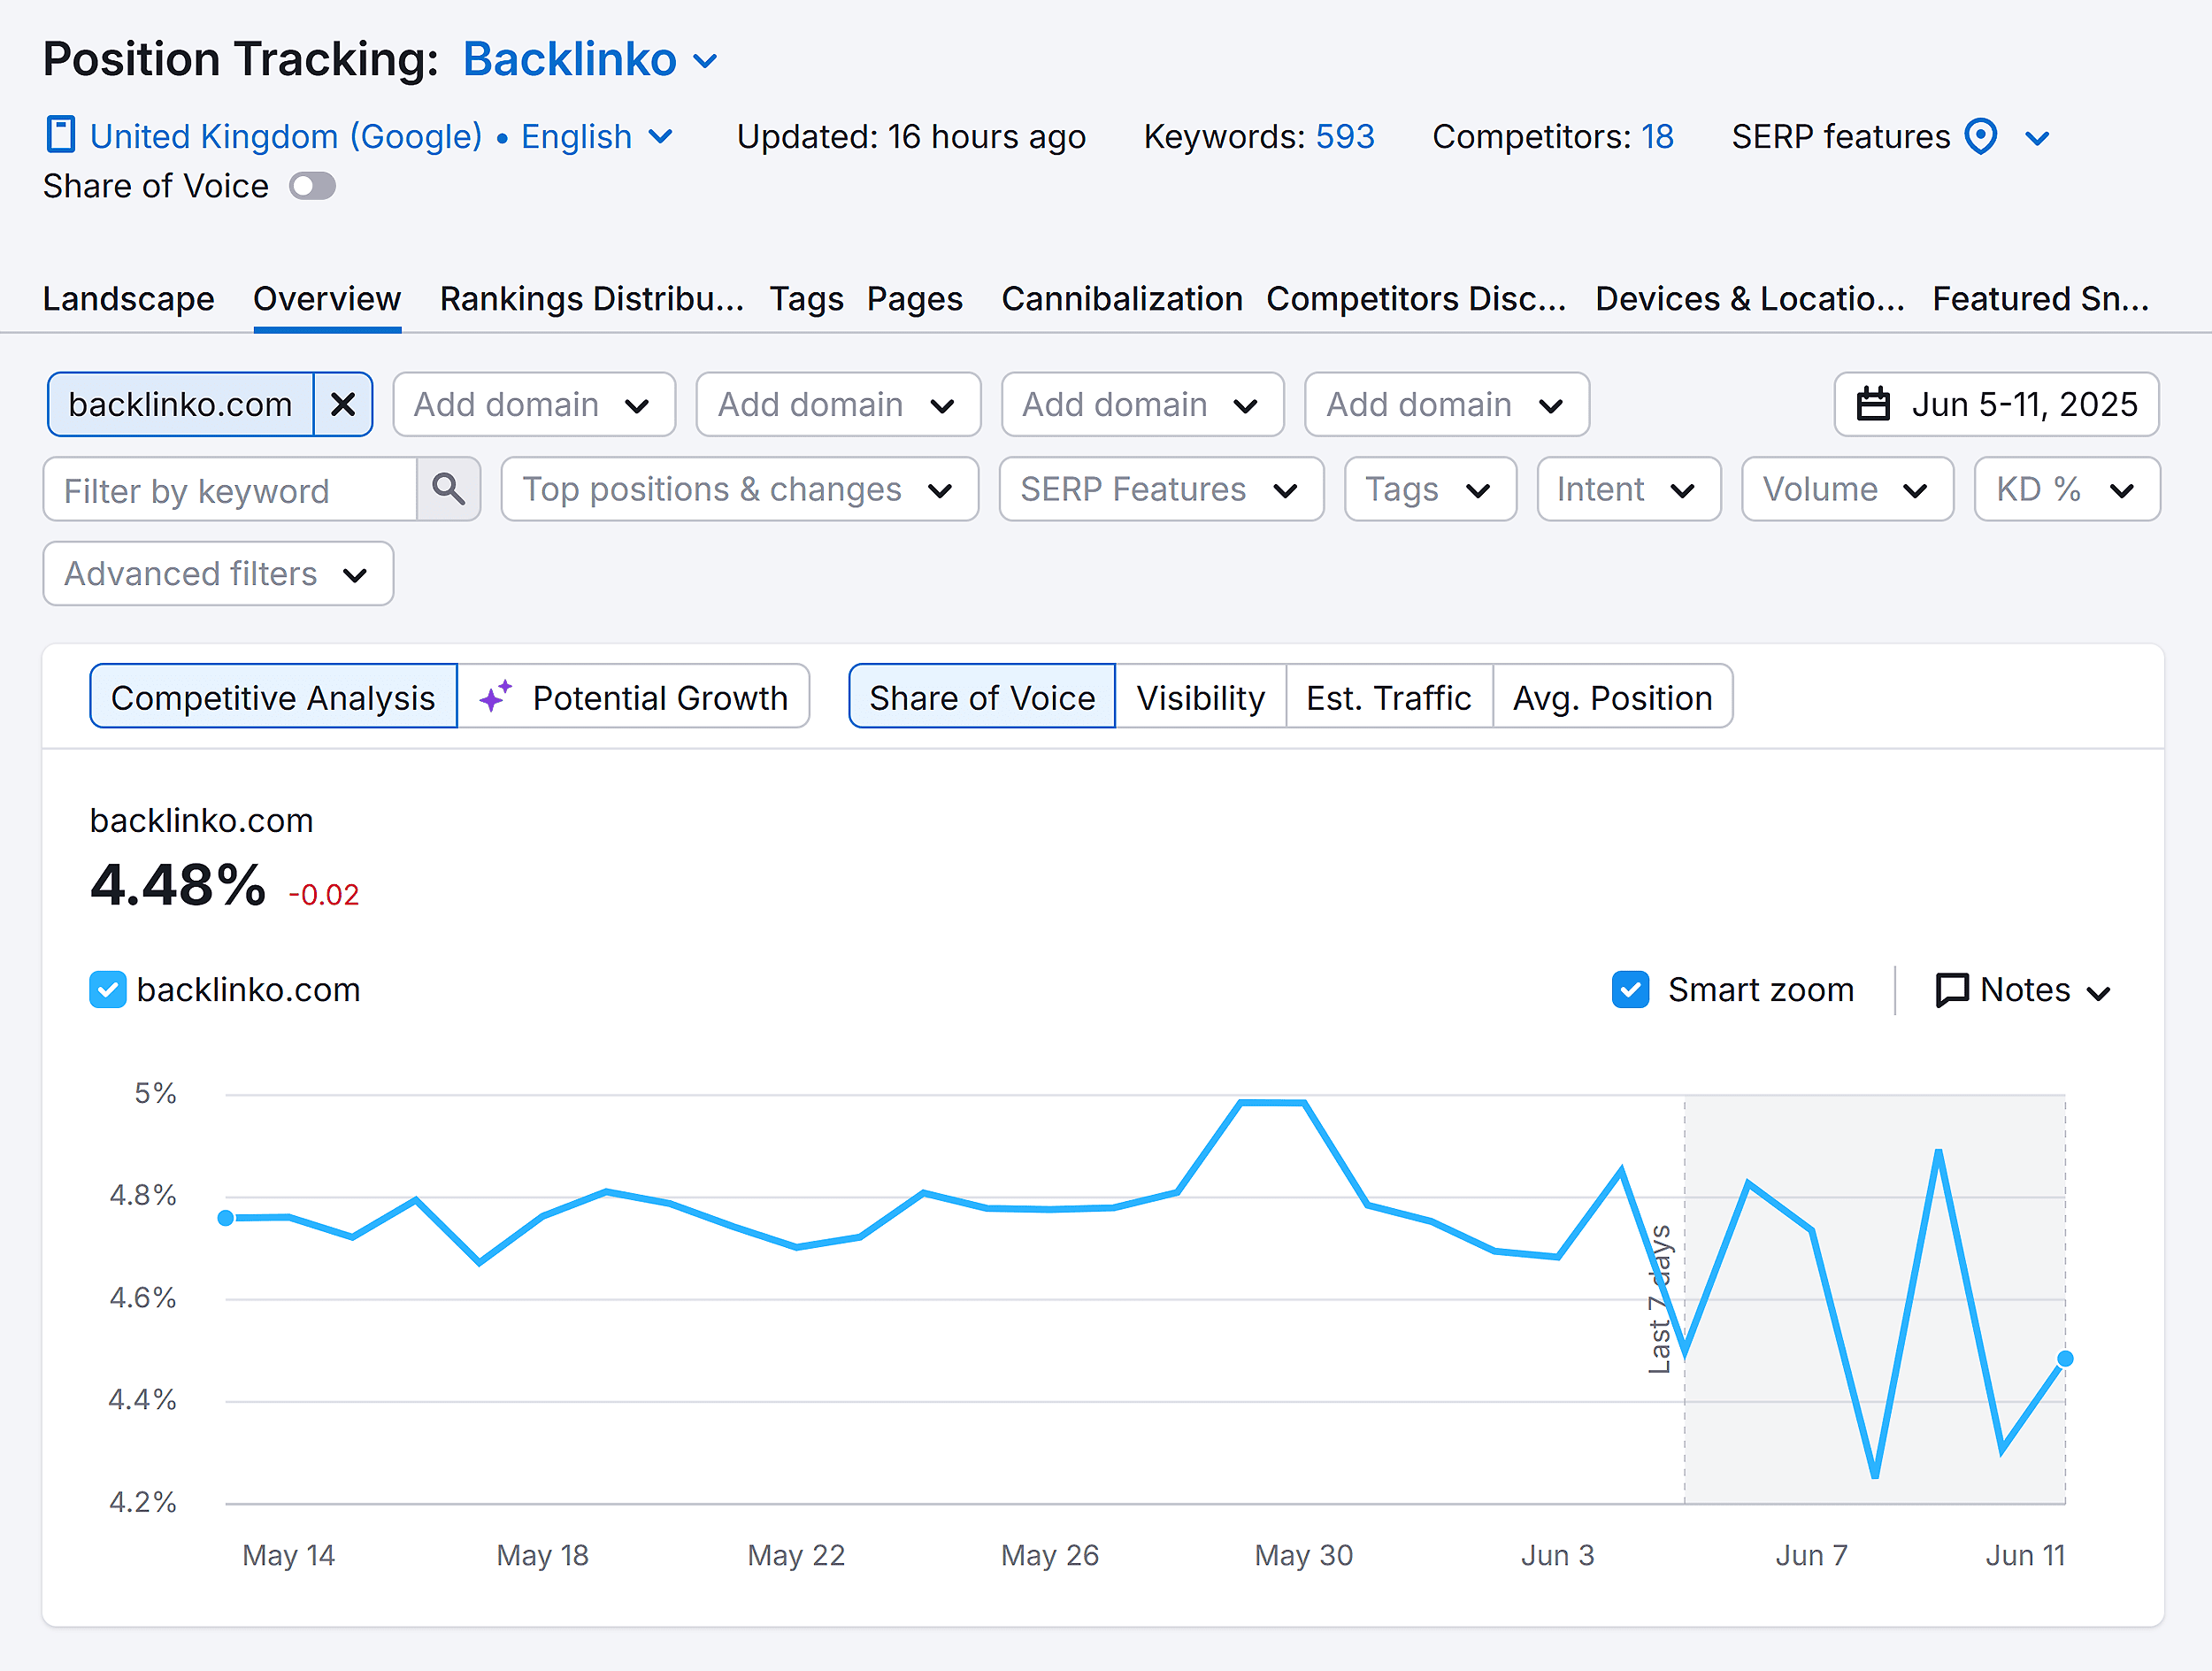
Begin by extracting keywords where the brand already has visibility. Google Search Console (GSC) is an invaluable resource, providing actual impression data—every time the brand appeared in search results, regardless of a click. Sorting the "Queries" tab by "Impressions" in descending order provides a list of top-performing keywords. Similarly, if running Google Ads, exporting high-converting or high-CTR PPC keywords can inform the organic strategy. Tools like Semrush’s Position Tracking offer a more automated approach, allowing brands to monitor their and their competitors’ rankings for a defined set of keywords, providing insights into potential traffic share.
Layering in Competitor Intelligence
Competitor analysis reveals overlooked opportunities. Semrush’s Keyword Gap tool allows brands to compare their domain against up to four competitors, identifying "missing" keywords—terms with proven search demand where competitors rank, but the brand does not. For our project management example, this might uncover a need to target keywords like "Gantt chart software" or "project management for remote teams" if competitors are capturing significant visibility there.
Building Your AI Prompt Library
AI search queries are inherently more conversational and often mirror discussions in online communities. Therefore, building an AI prompt library involves:
- Community Monitoring: Browsing Reddit, Facebook groups, Slack channels, and other industry forums to understand how the target audience phrases their needs, pain points, and questions. For instance, a Reddit thread discussing "user-friendly project management tools for small creative agencies" can directly inspire prompts like "What’s the most intuitive project management solution for creative teams?"
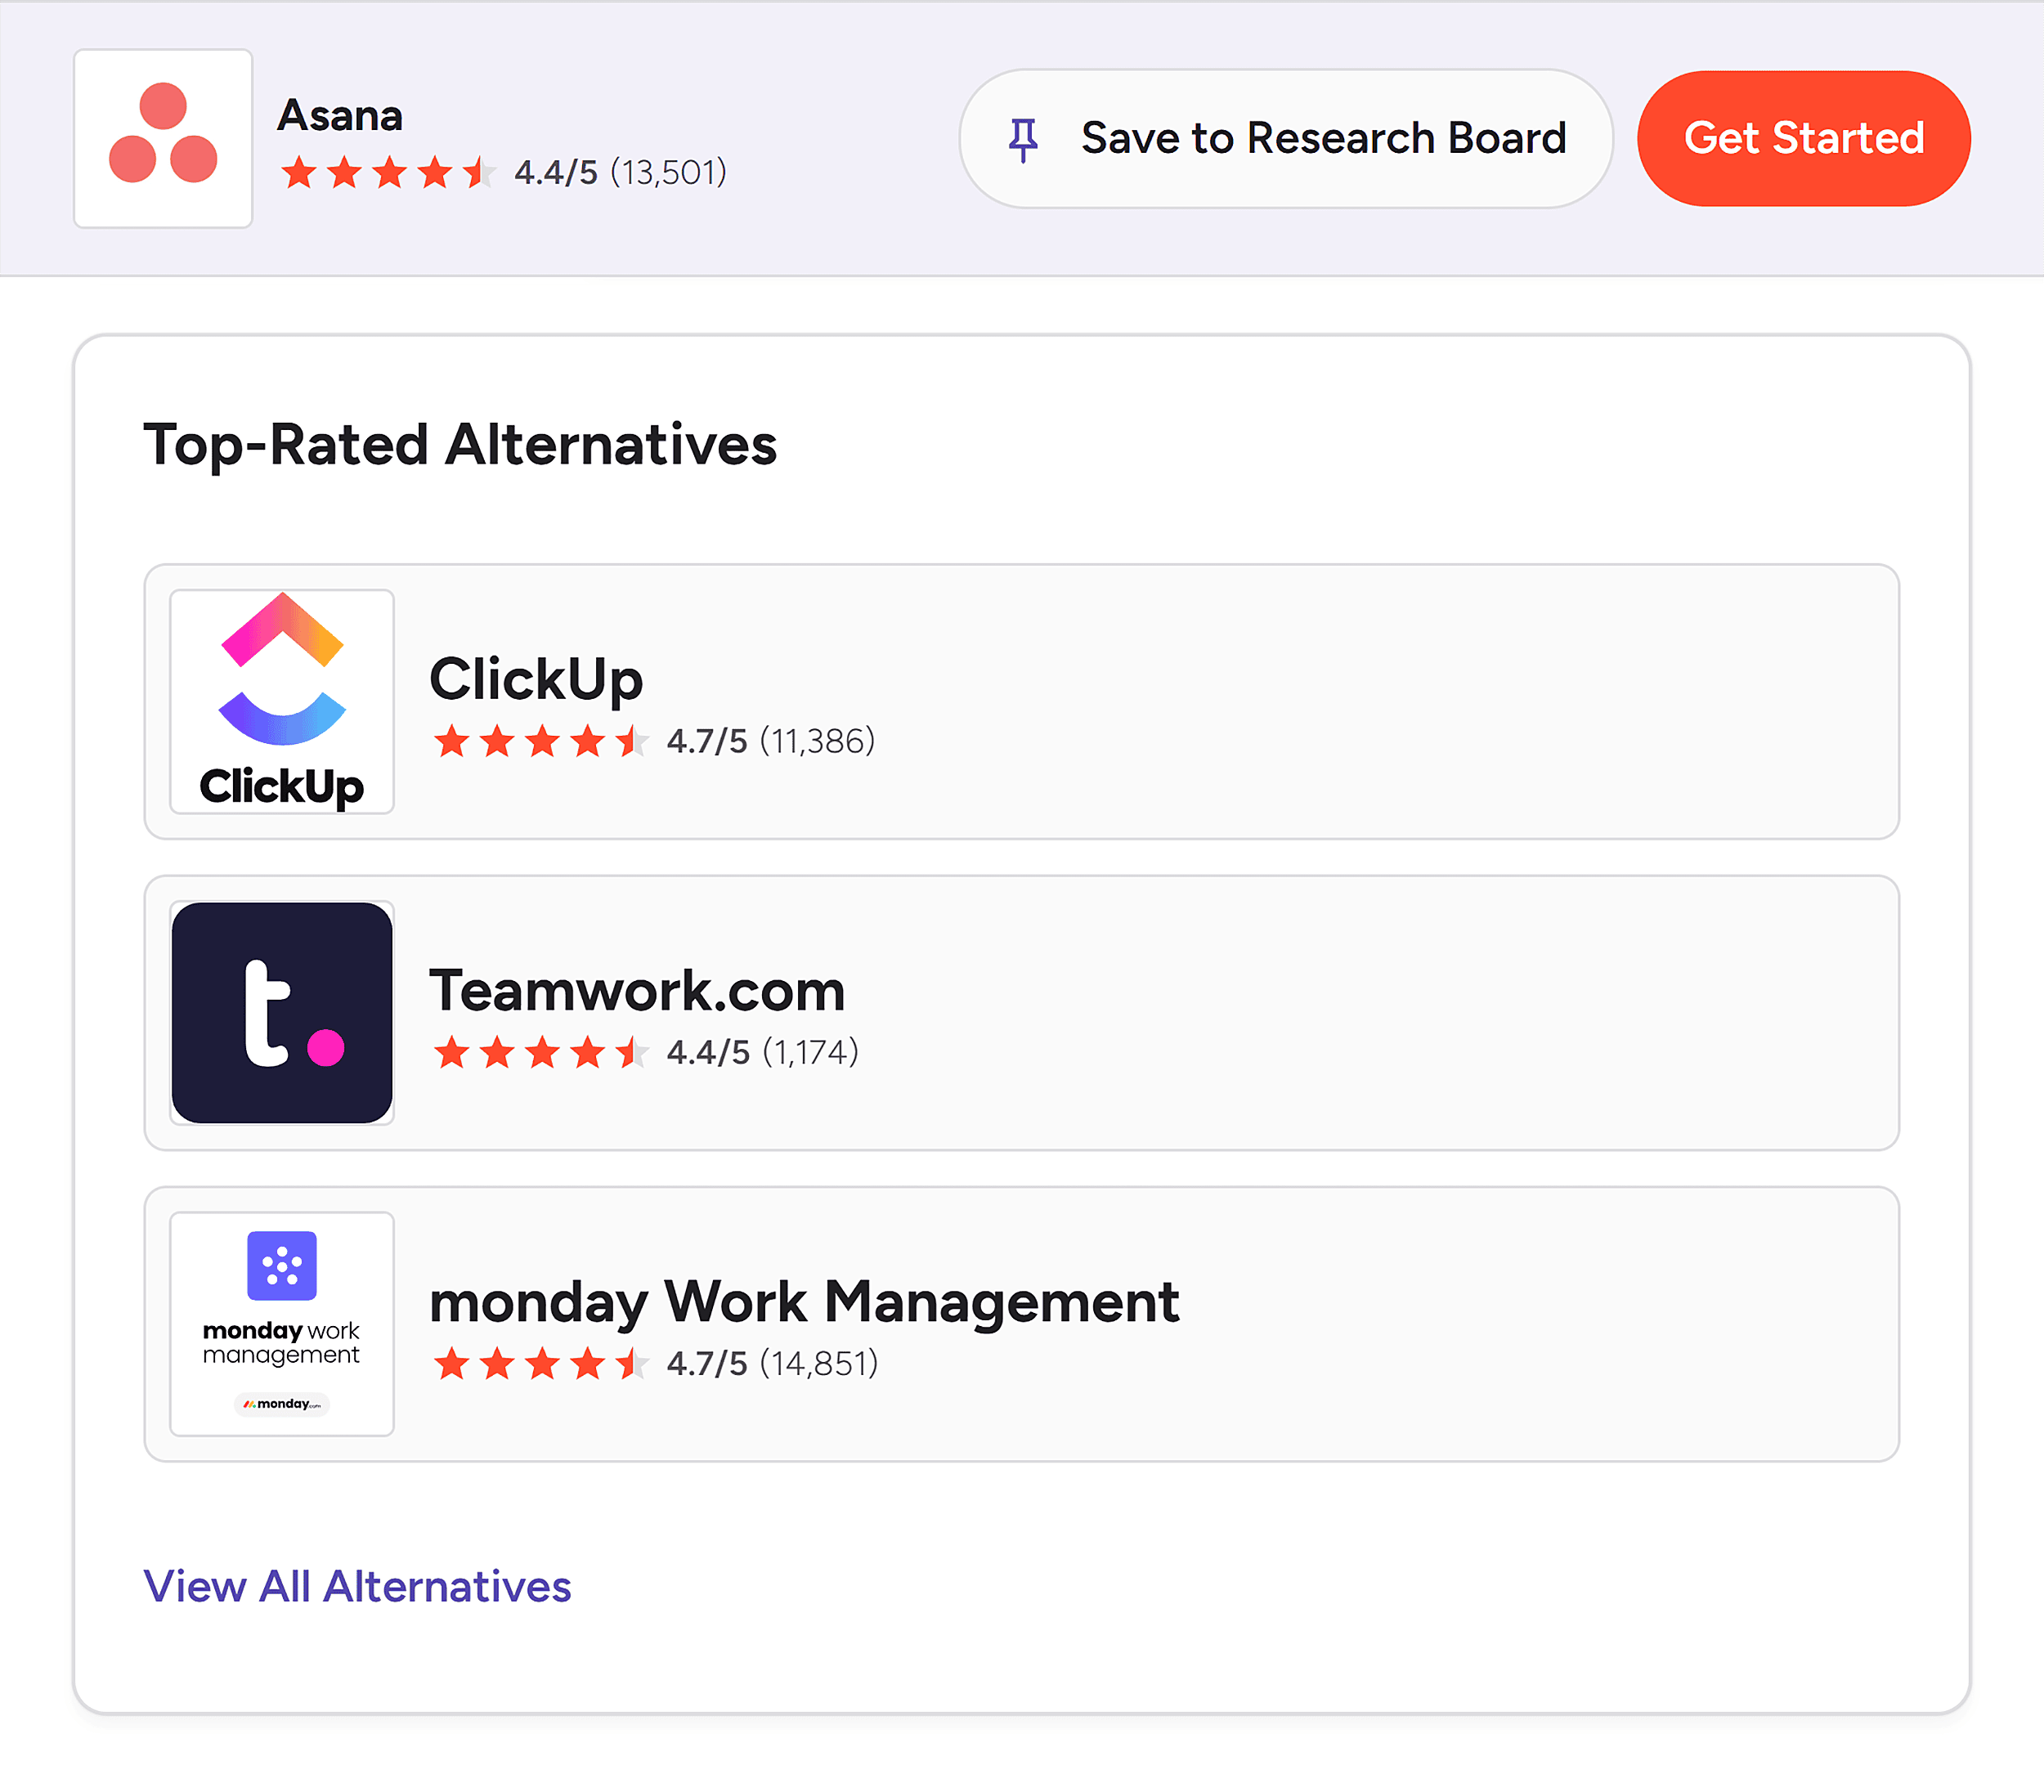
- Review Site Analysis: Platforms like G2 and Capterra are goldmines for decision-stage prompts. They often list "alternatives to [Competitor]" or "[Your Brand] vs. [Competitor]," which are natural AI queries.
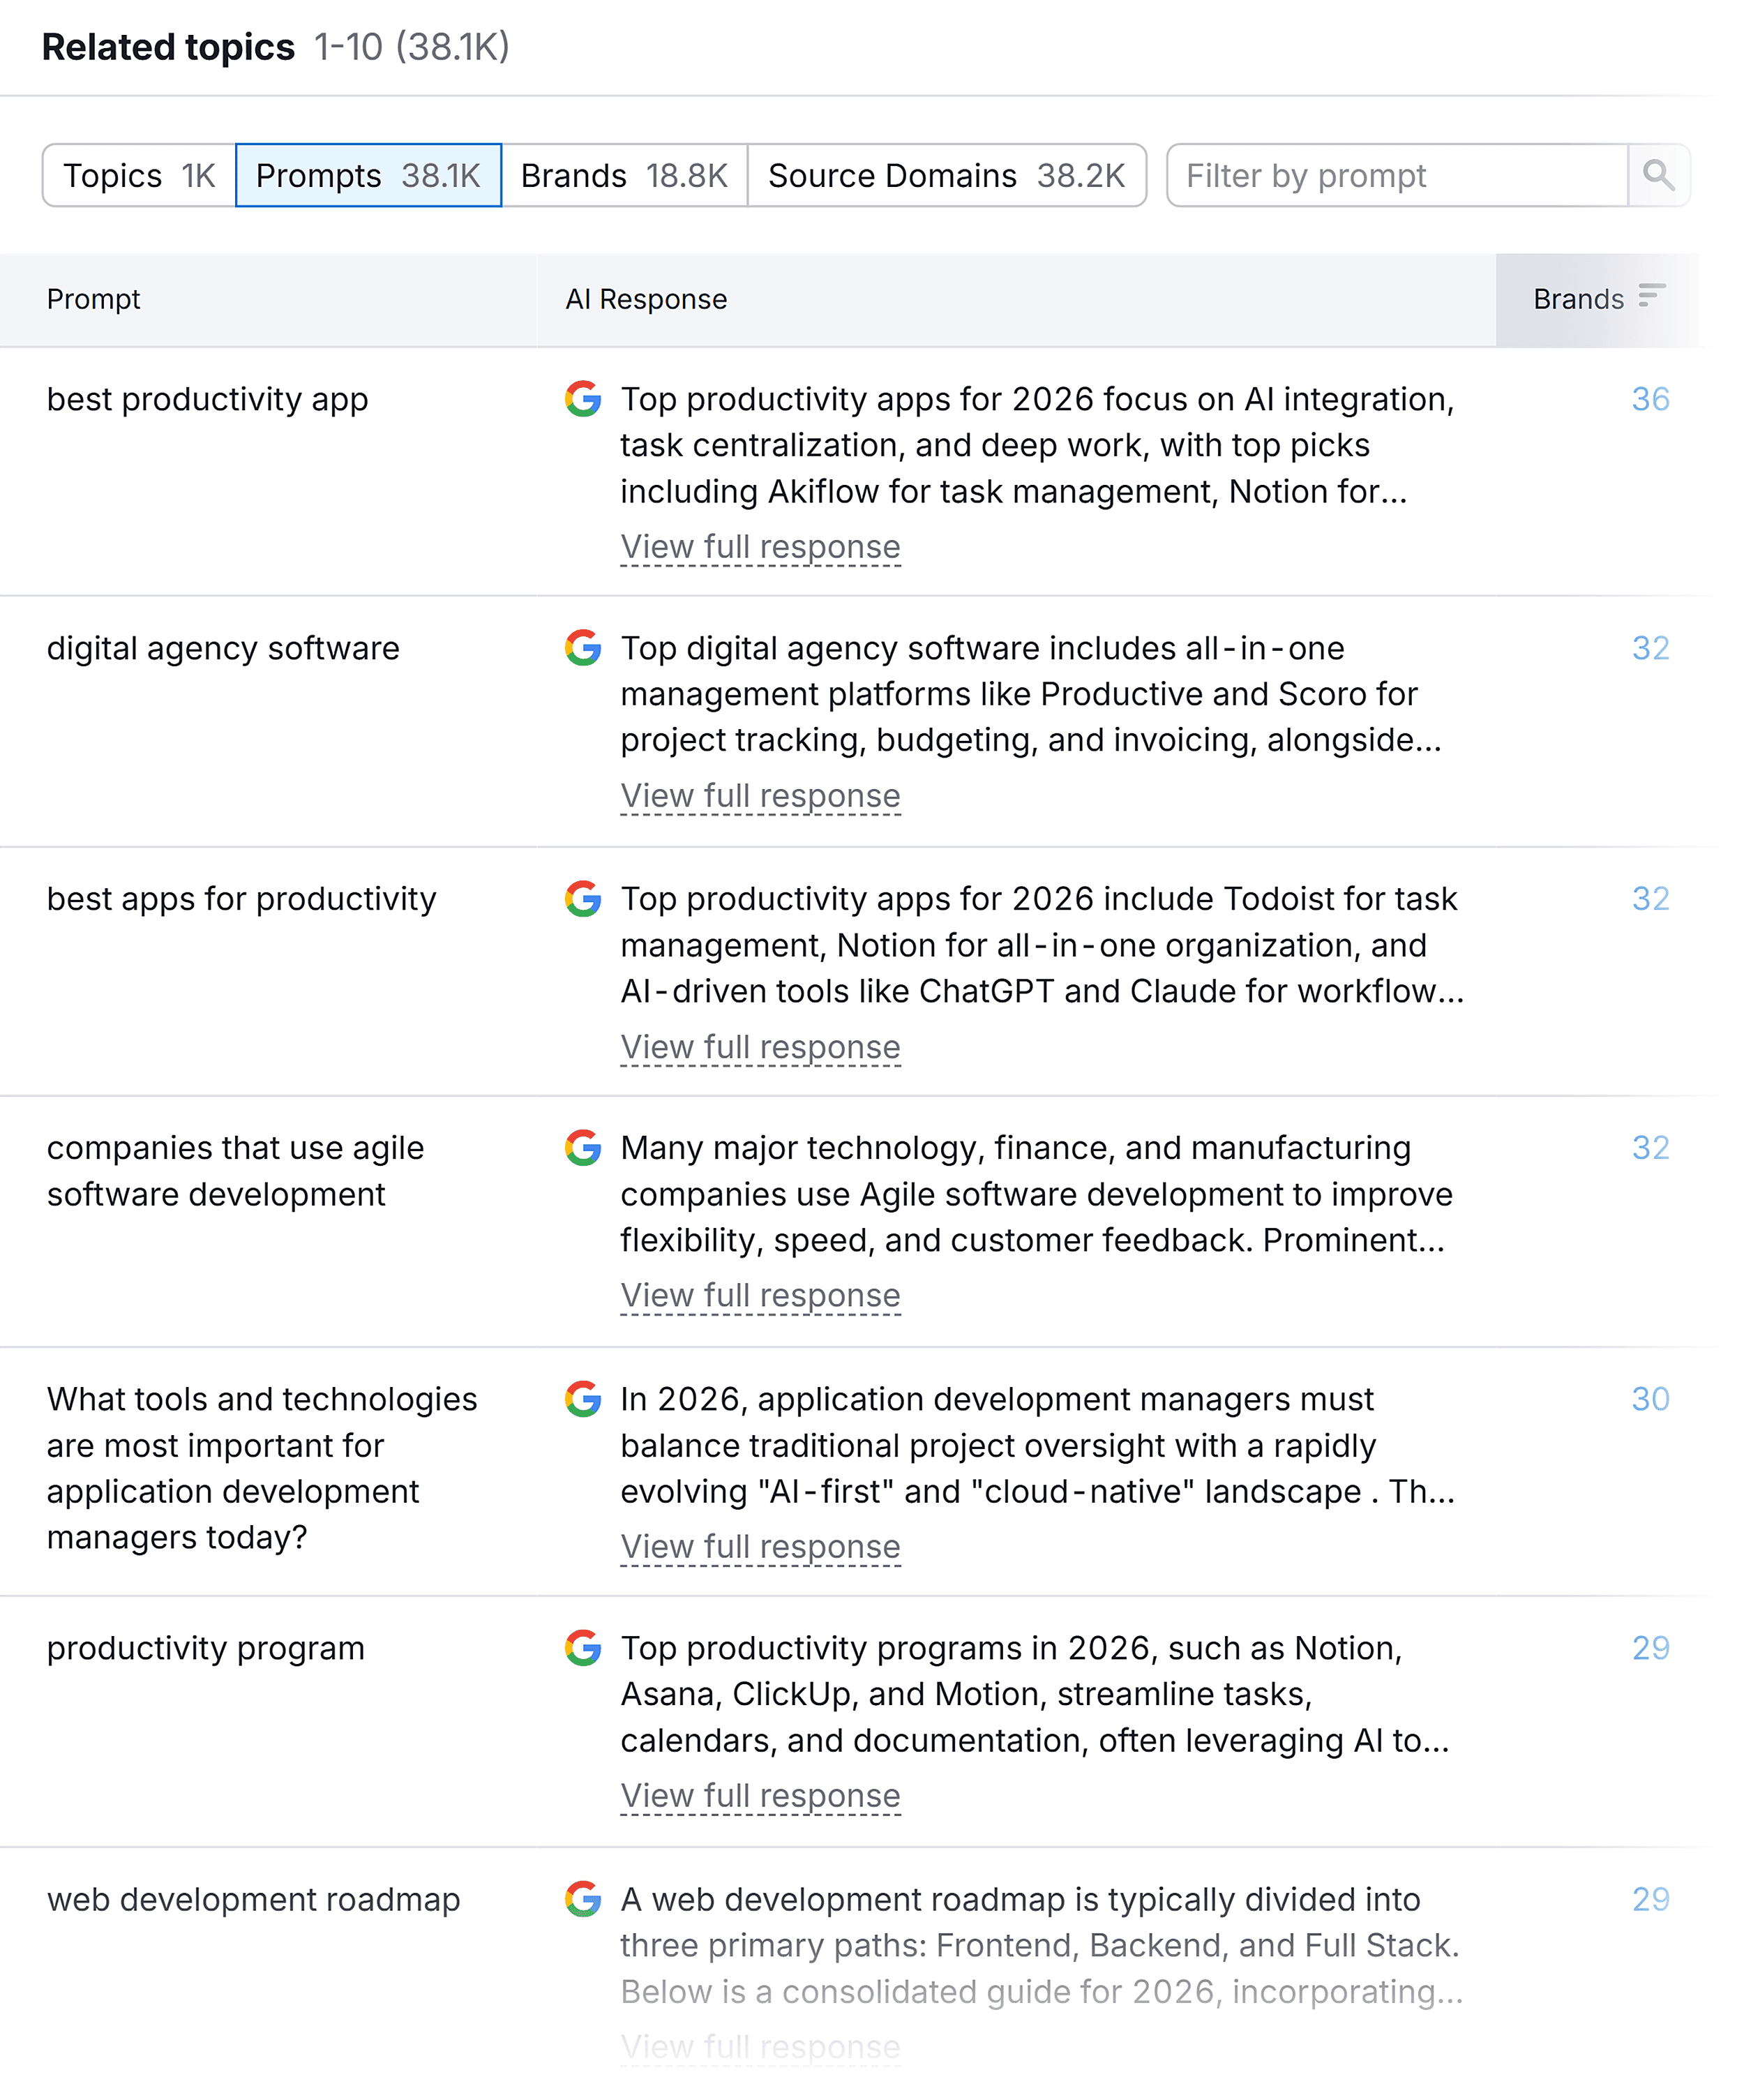
- AI Visibility Tools: Dedicated tools, such as Semrush’s AI Visibility Toolkit, allow brands to input core topics (e.g., "agile project management") and discover real-world prompts that generate AI responses in their category. This helps identify prompts where competitors are mentioned but the brand is not.
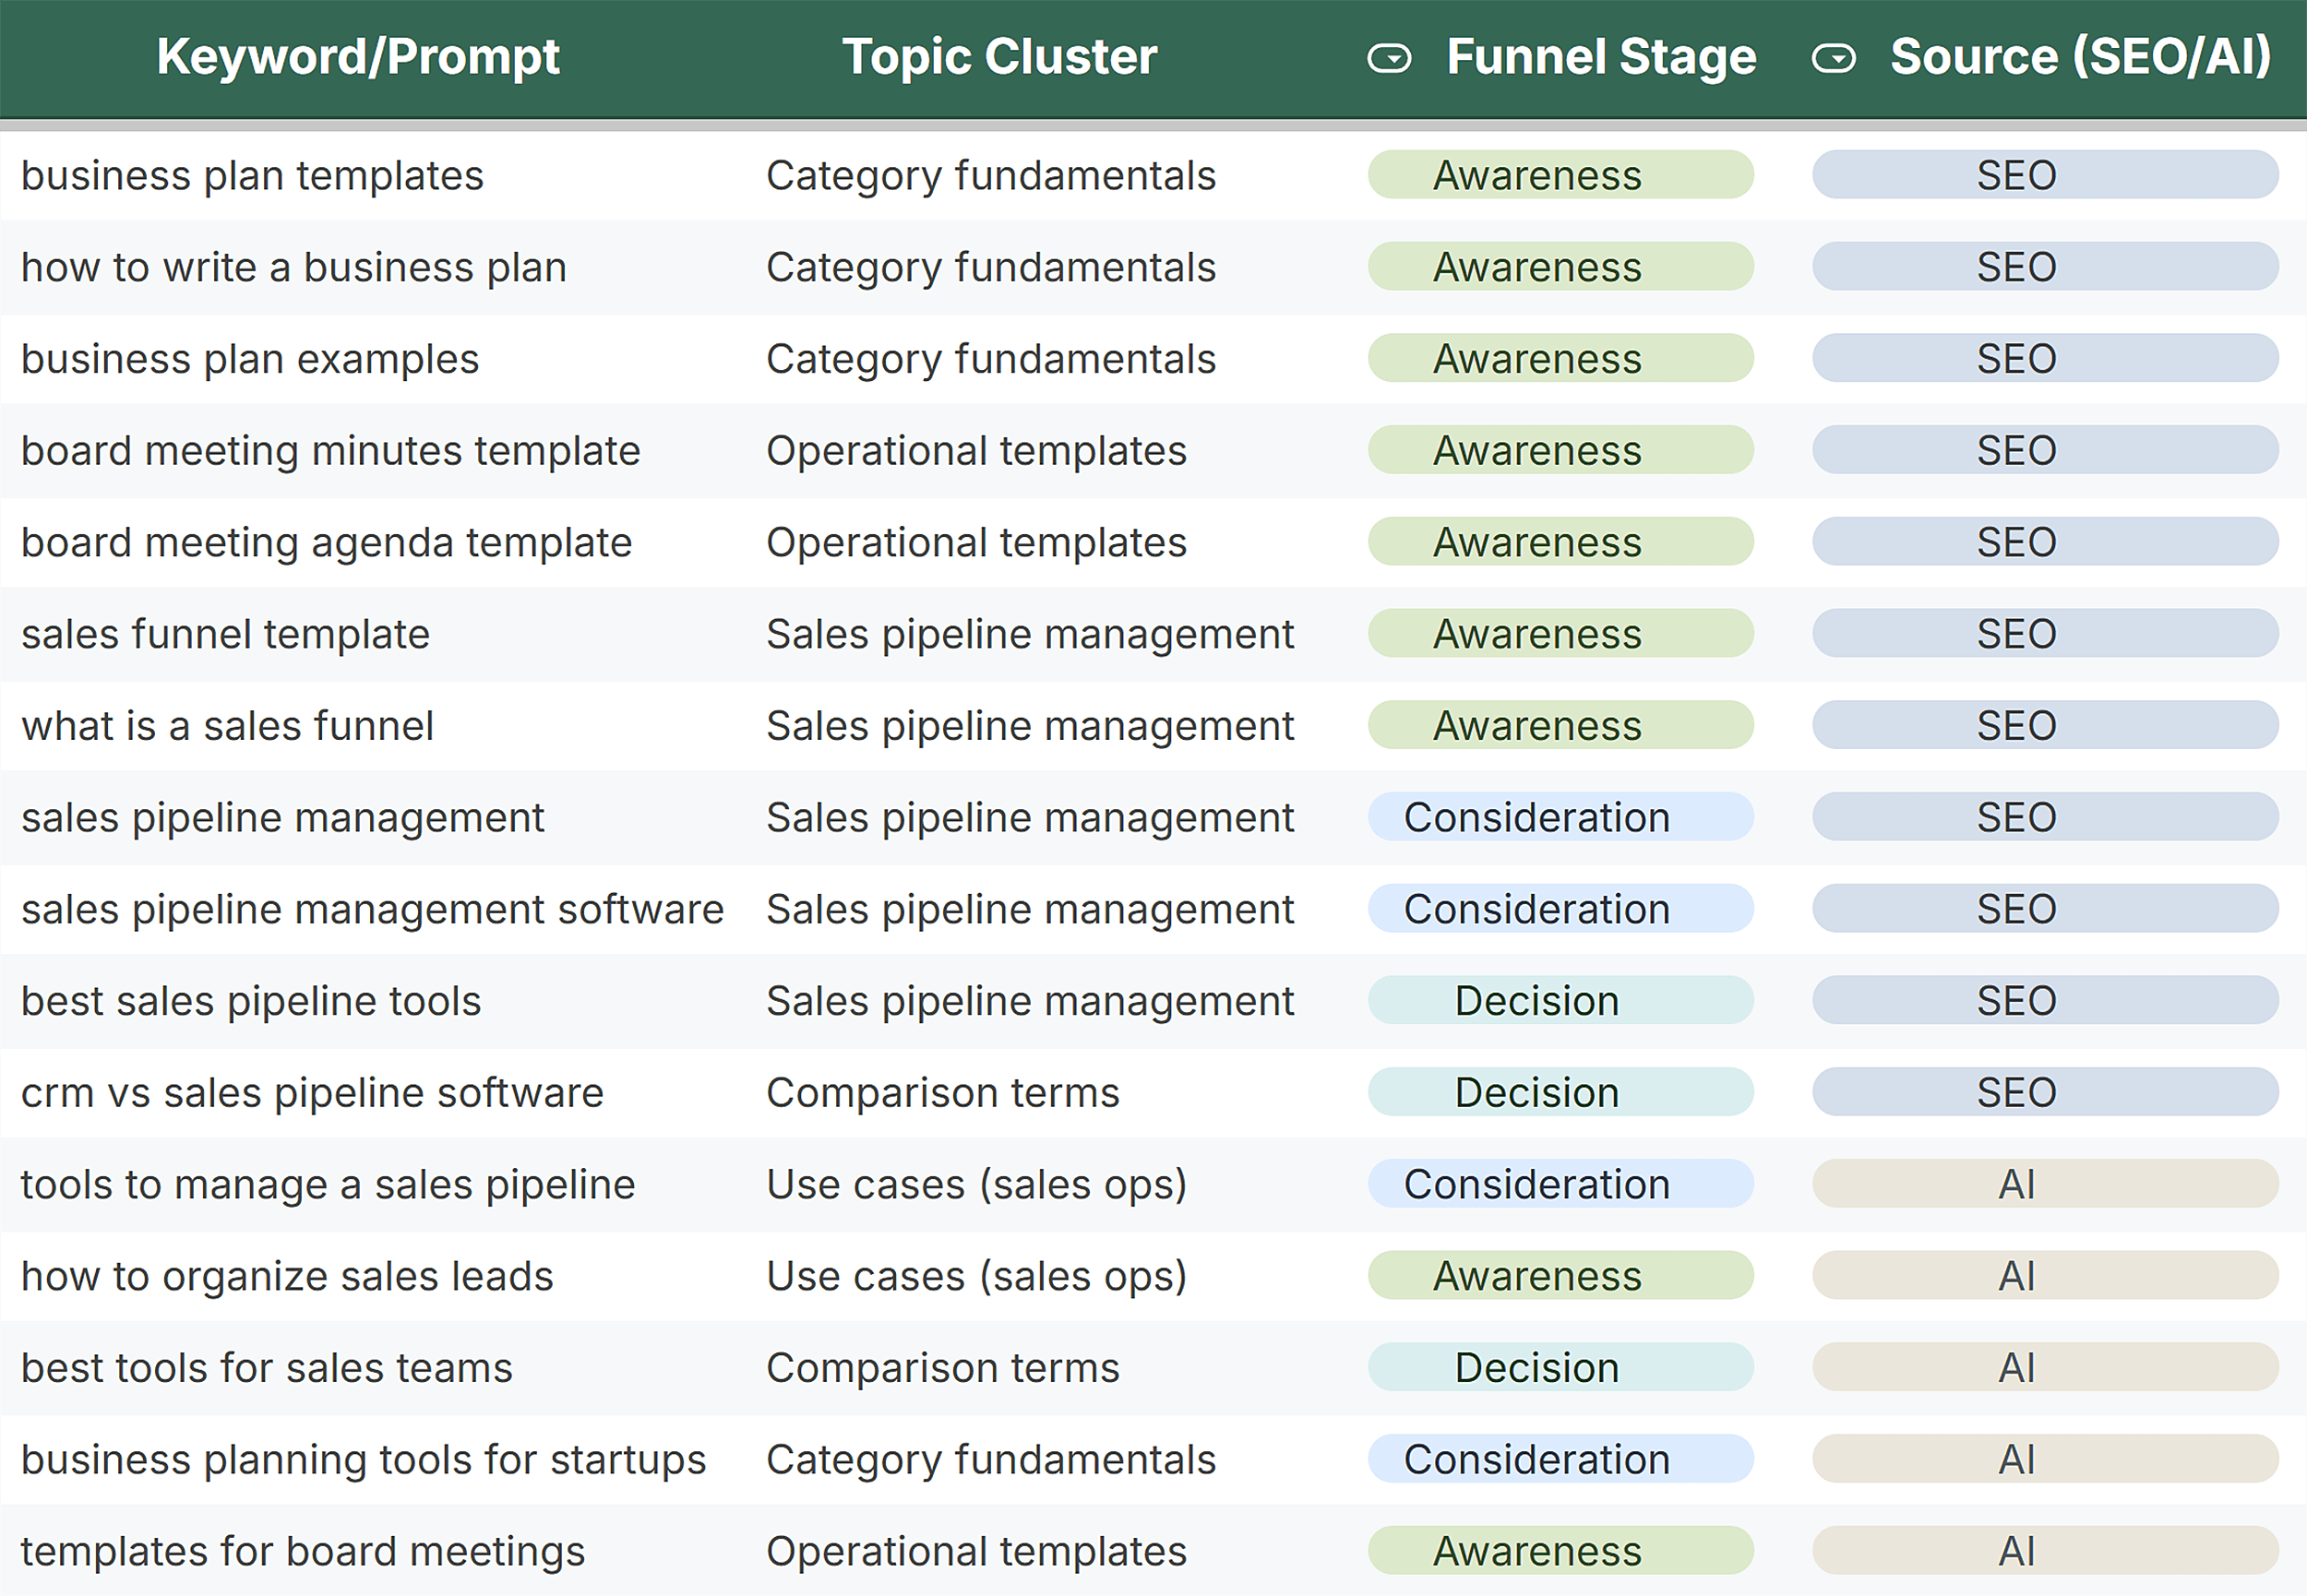
Finally, all this metadata—keywords, prompts, associated clusters, buyer journey stages, and competitor relevance—should be meticulously organized in a master spreadsheet. This structured data becomes the strategic lens through which SoV insights are interpreted.

Step 3: Calculating Your SoV Across Organic and AI Search
With the landscape defined and libraries built, the next step is the actual calculation of SoV for both organic and AI search.
Calculating SEO Share of Voice
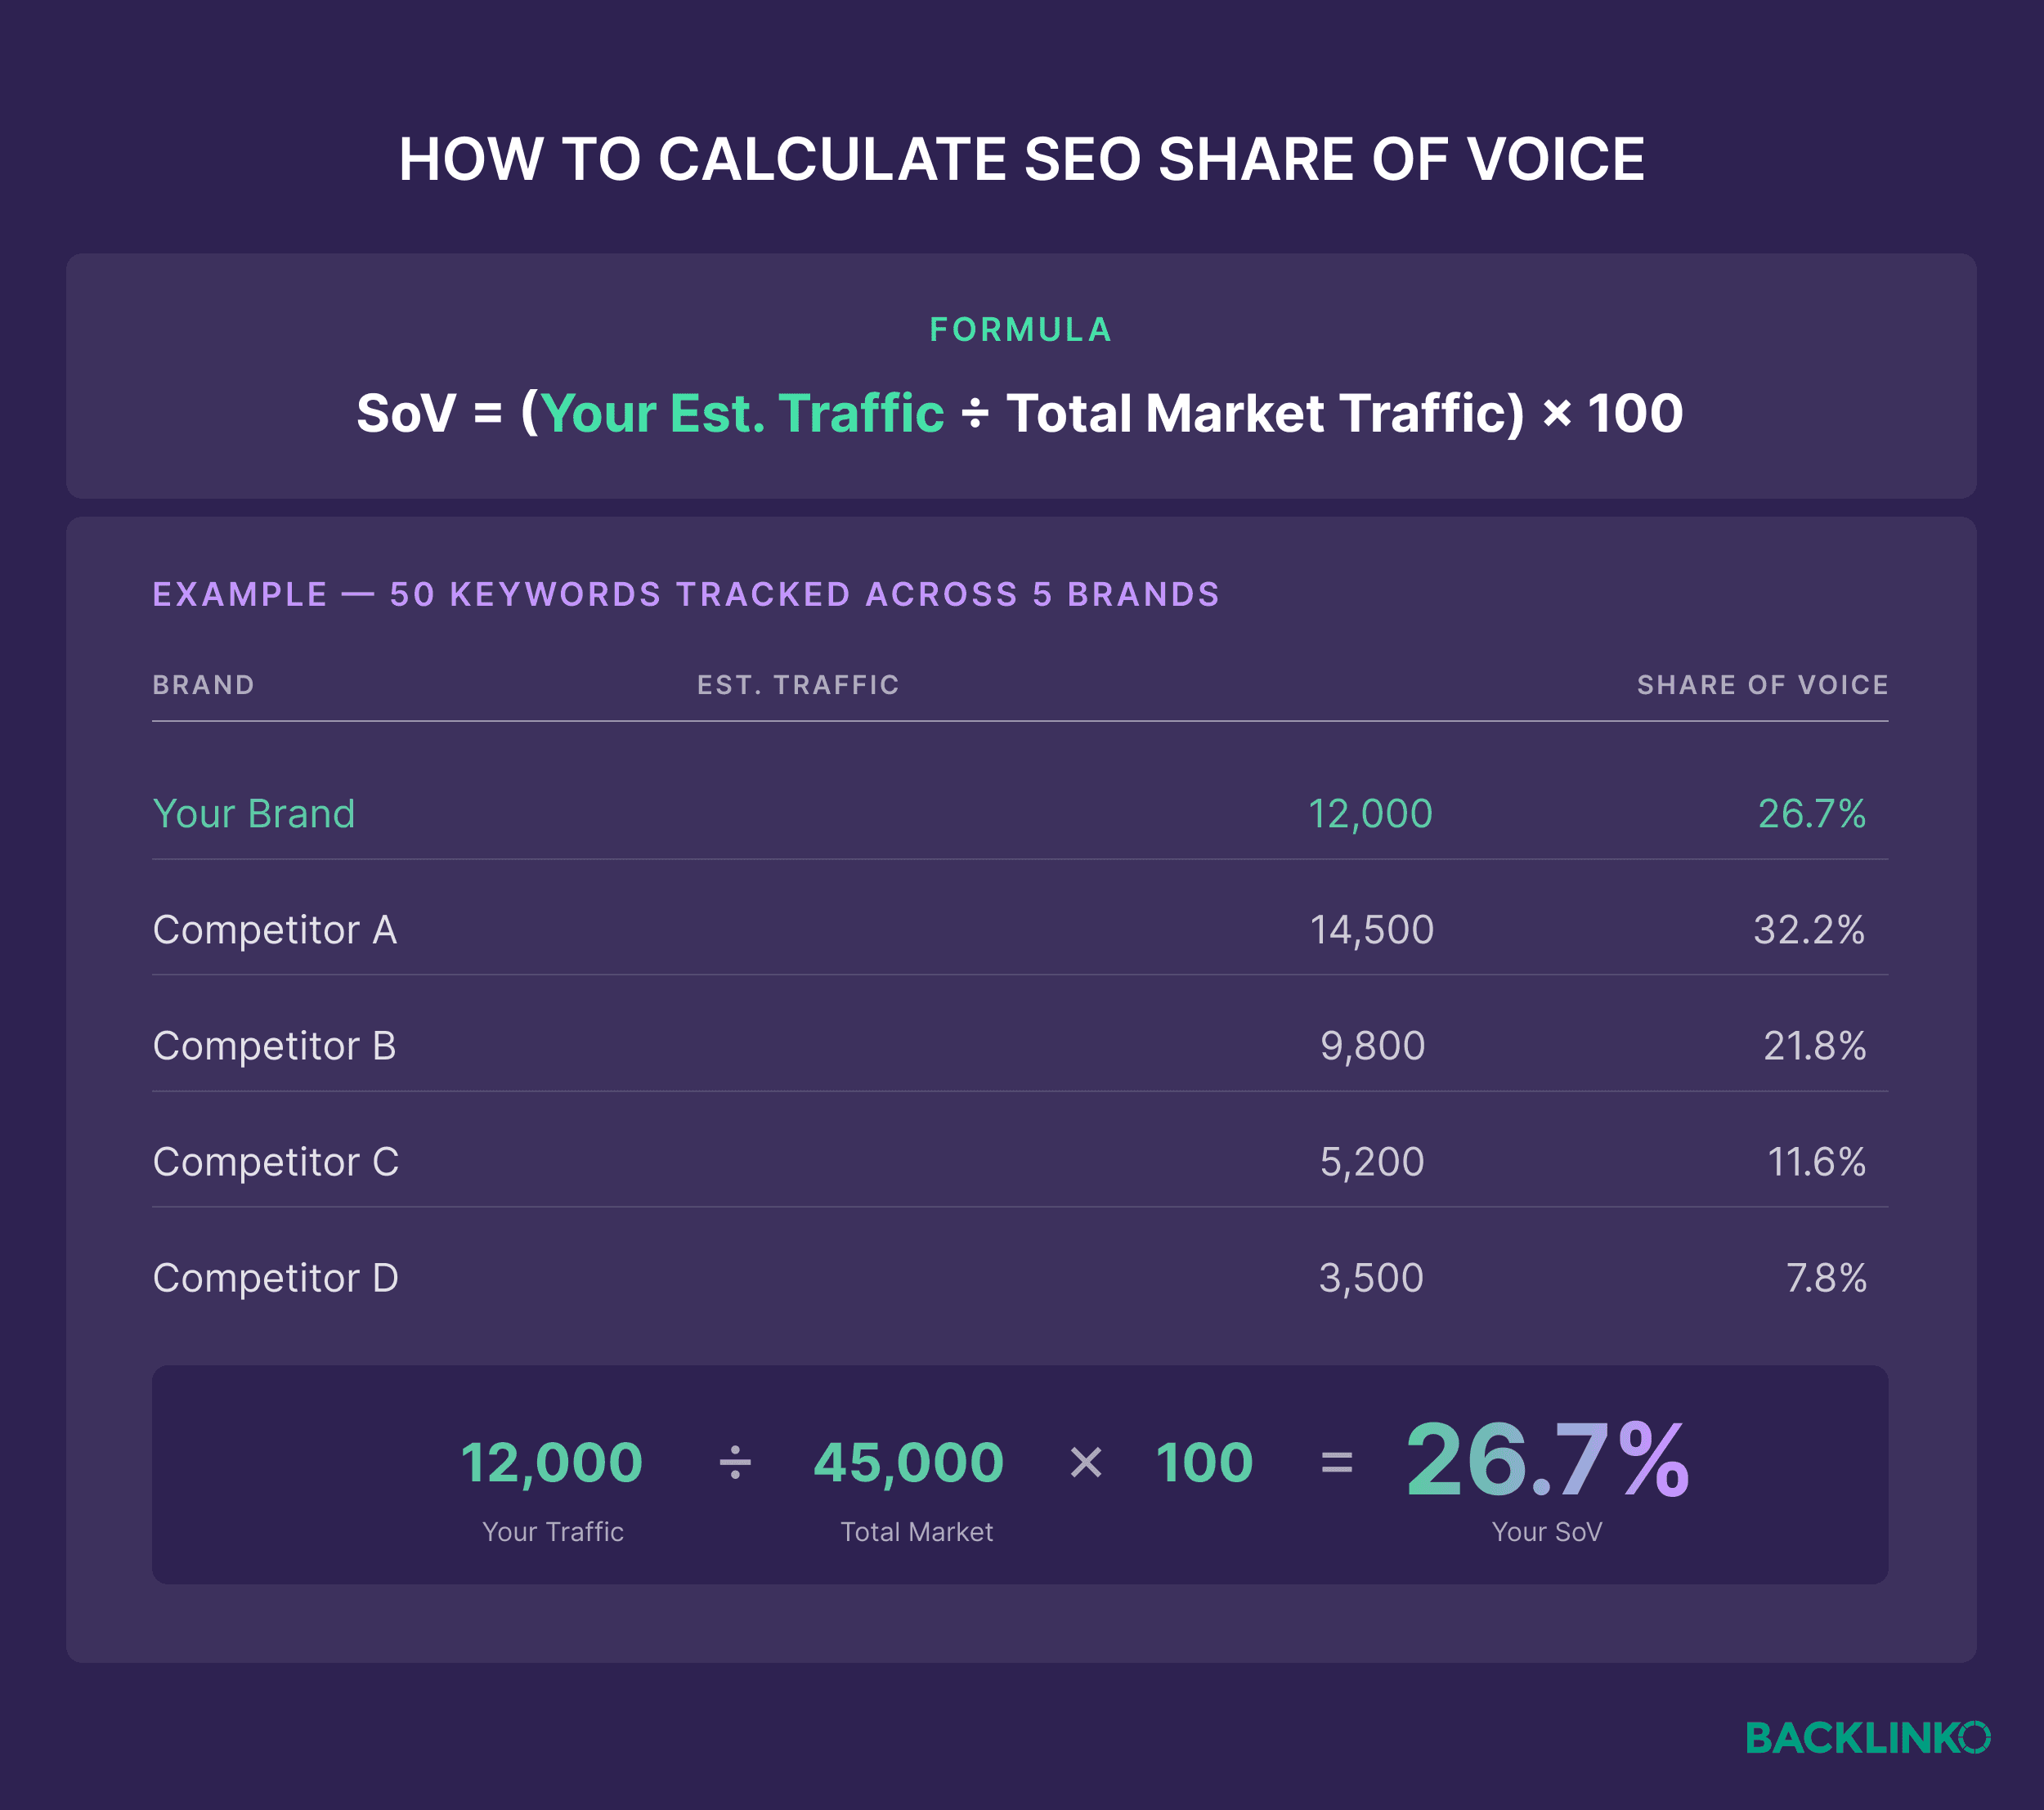
The manual calculation involves:
- Ranking Tracking: Monitor your brand’s and competitors’ rankings for all keywords in the library.
- Estimated Traffic Share: Apply an average click-through rate (CTR) to each ranking position. For instance, position 1 typically captures around 27% of clicks.
- Traffic Estimation: Multiply each keyword’s monthly search volume by the CTR for its ranking position to estimate traffic. Repeat for all keywords and all tracked brands.
- SoV Calculation: Sum estimated traffic for your brand. Sum estimated traffic for all tracked brands (including yours). Divide your total by the combined total and multiply by 100.
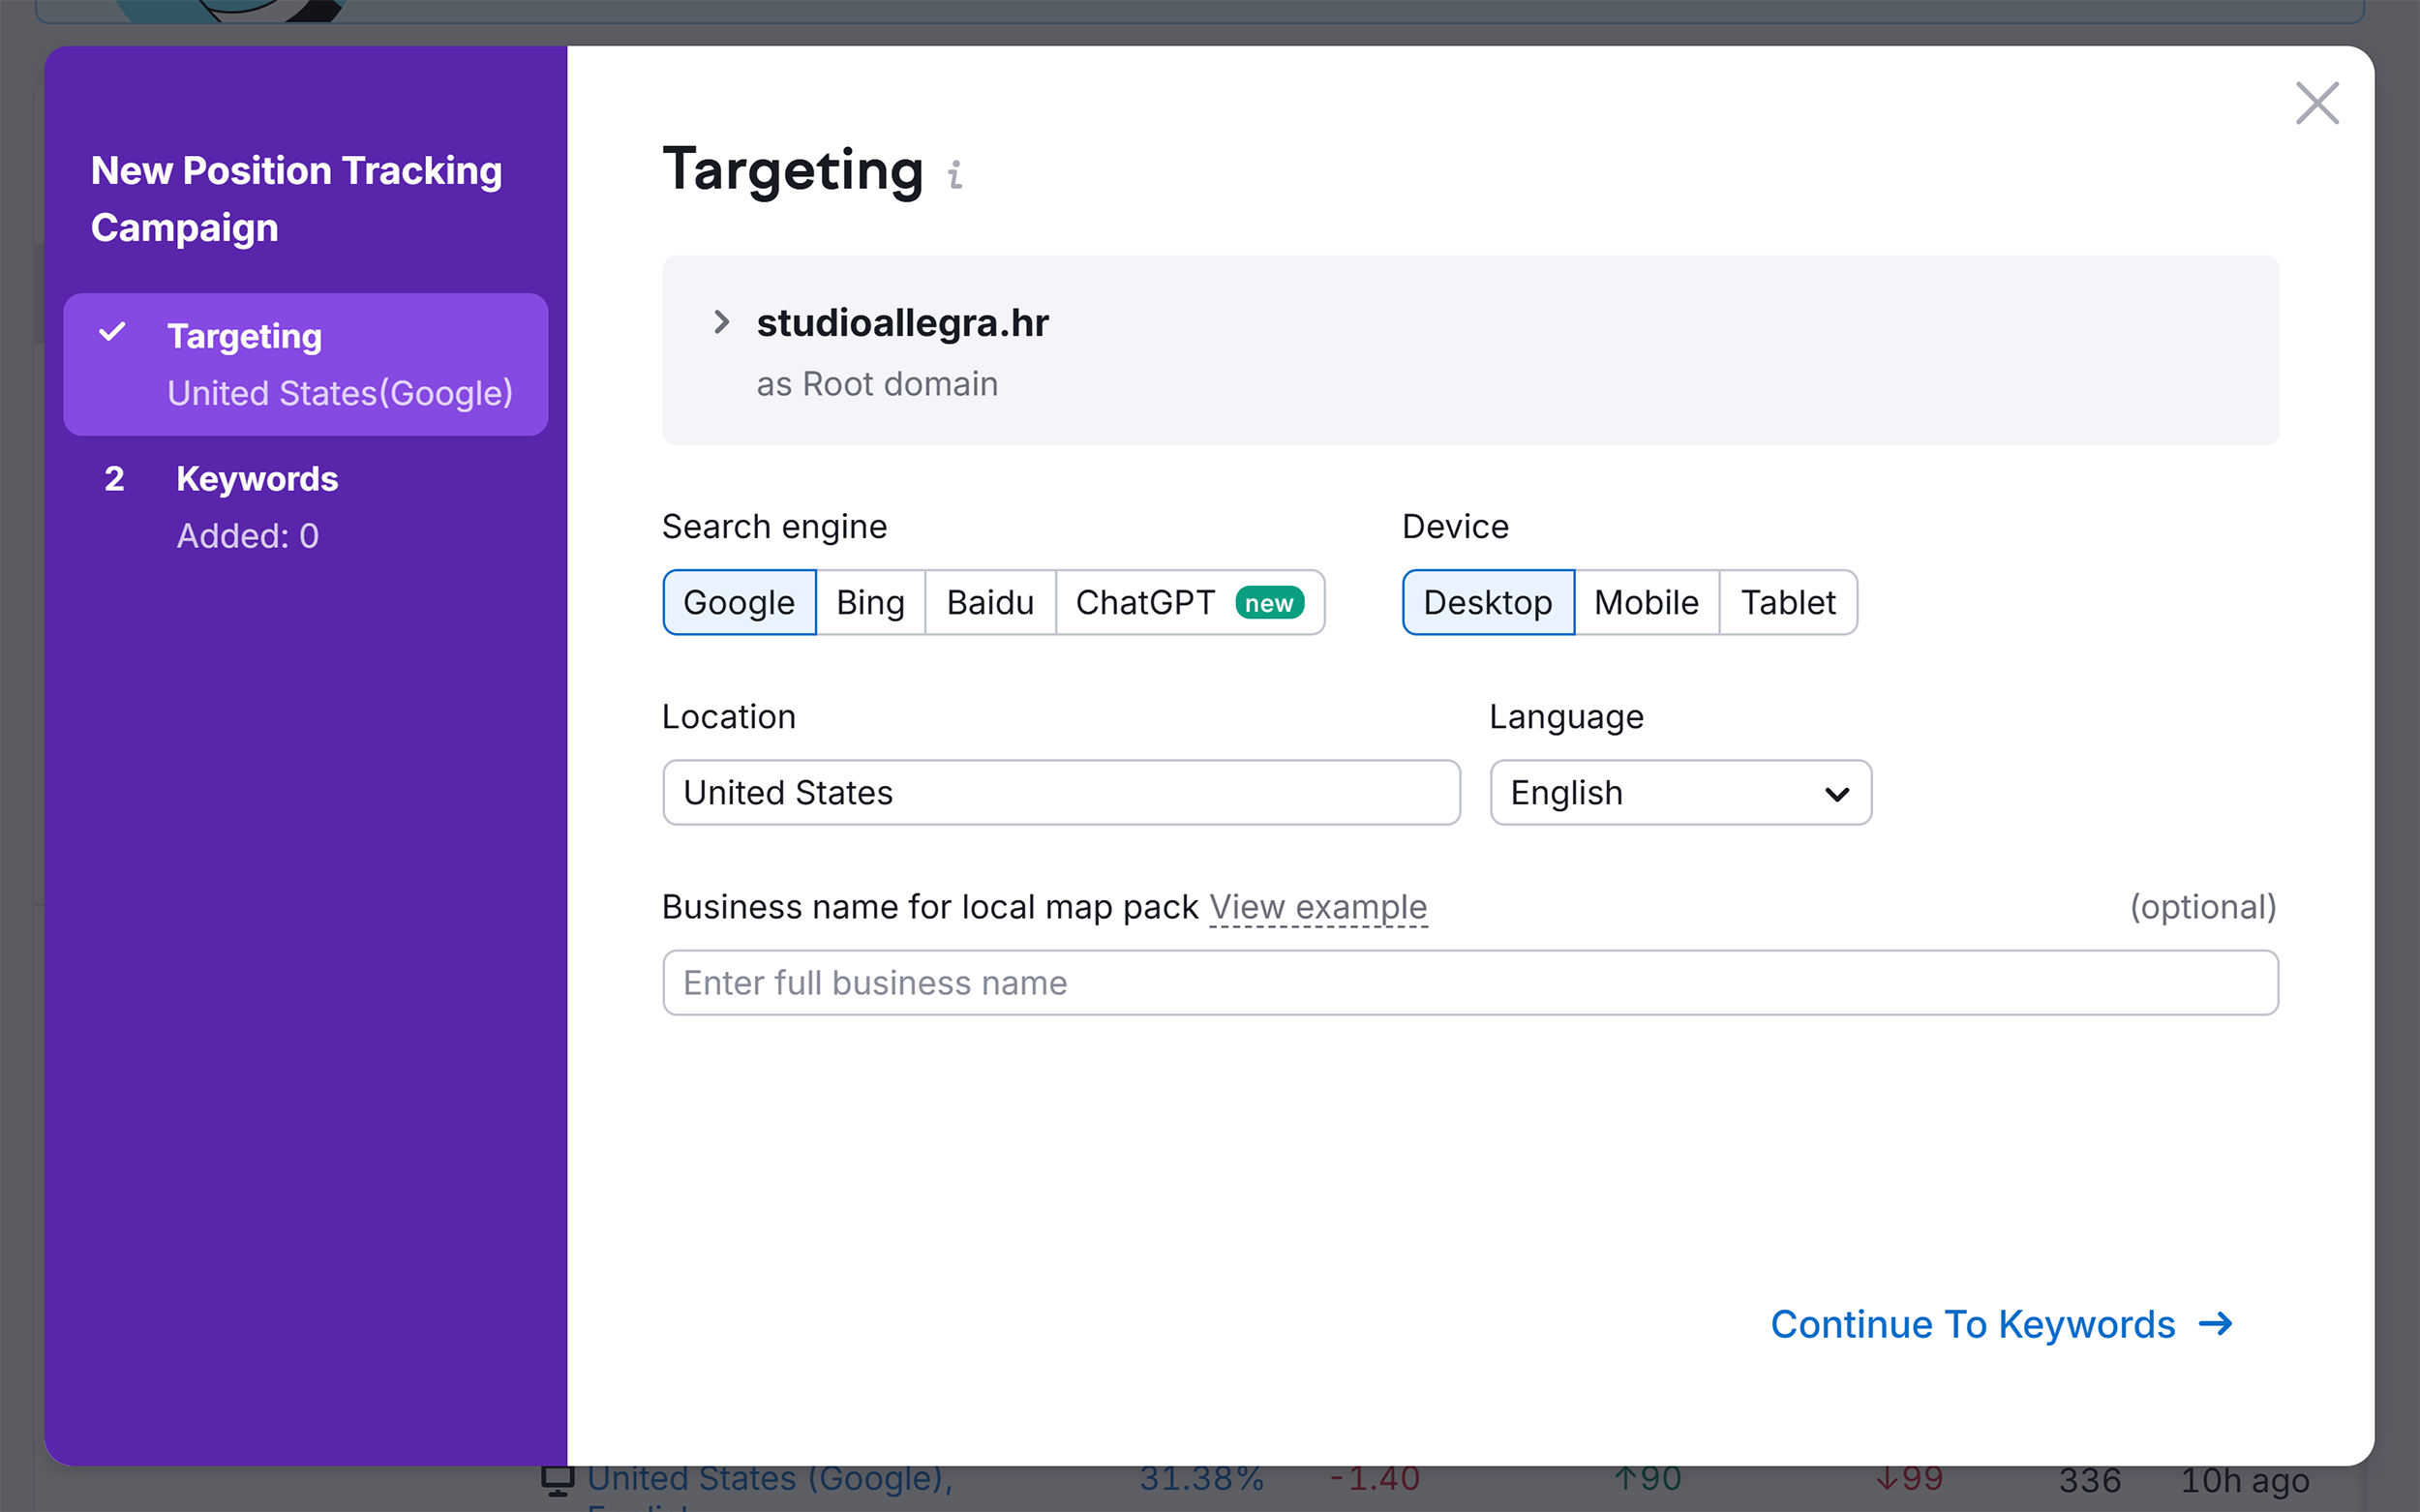
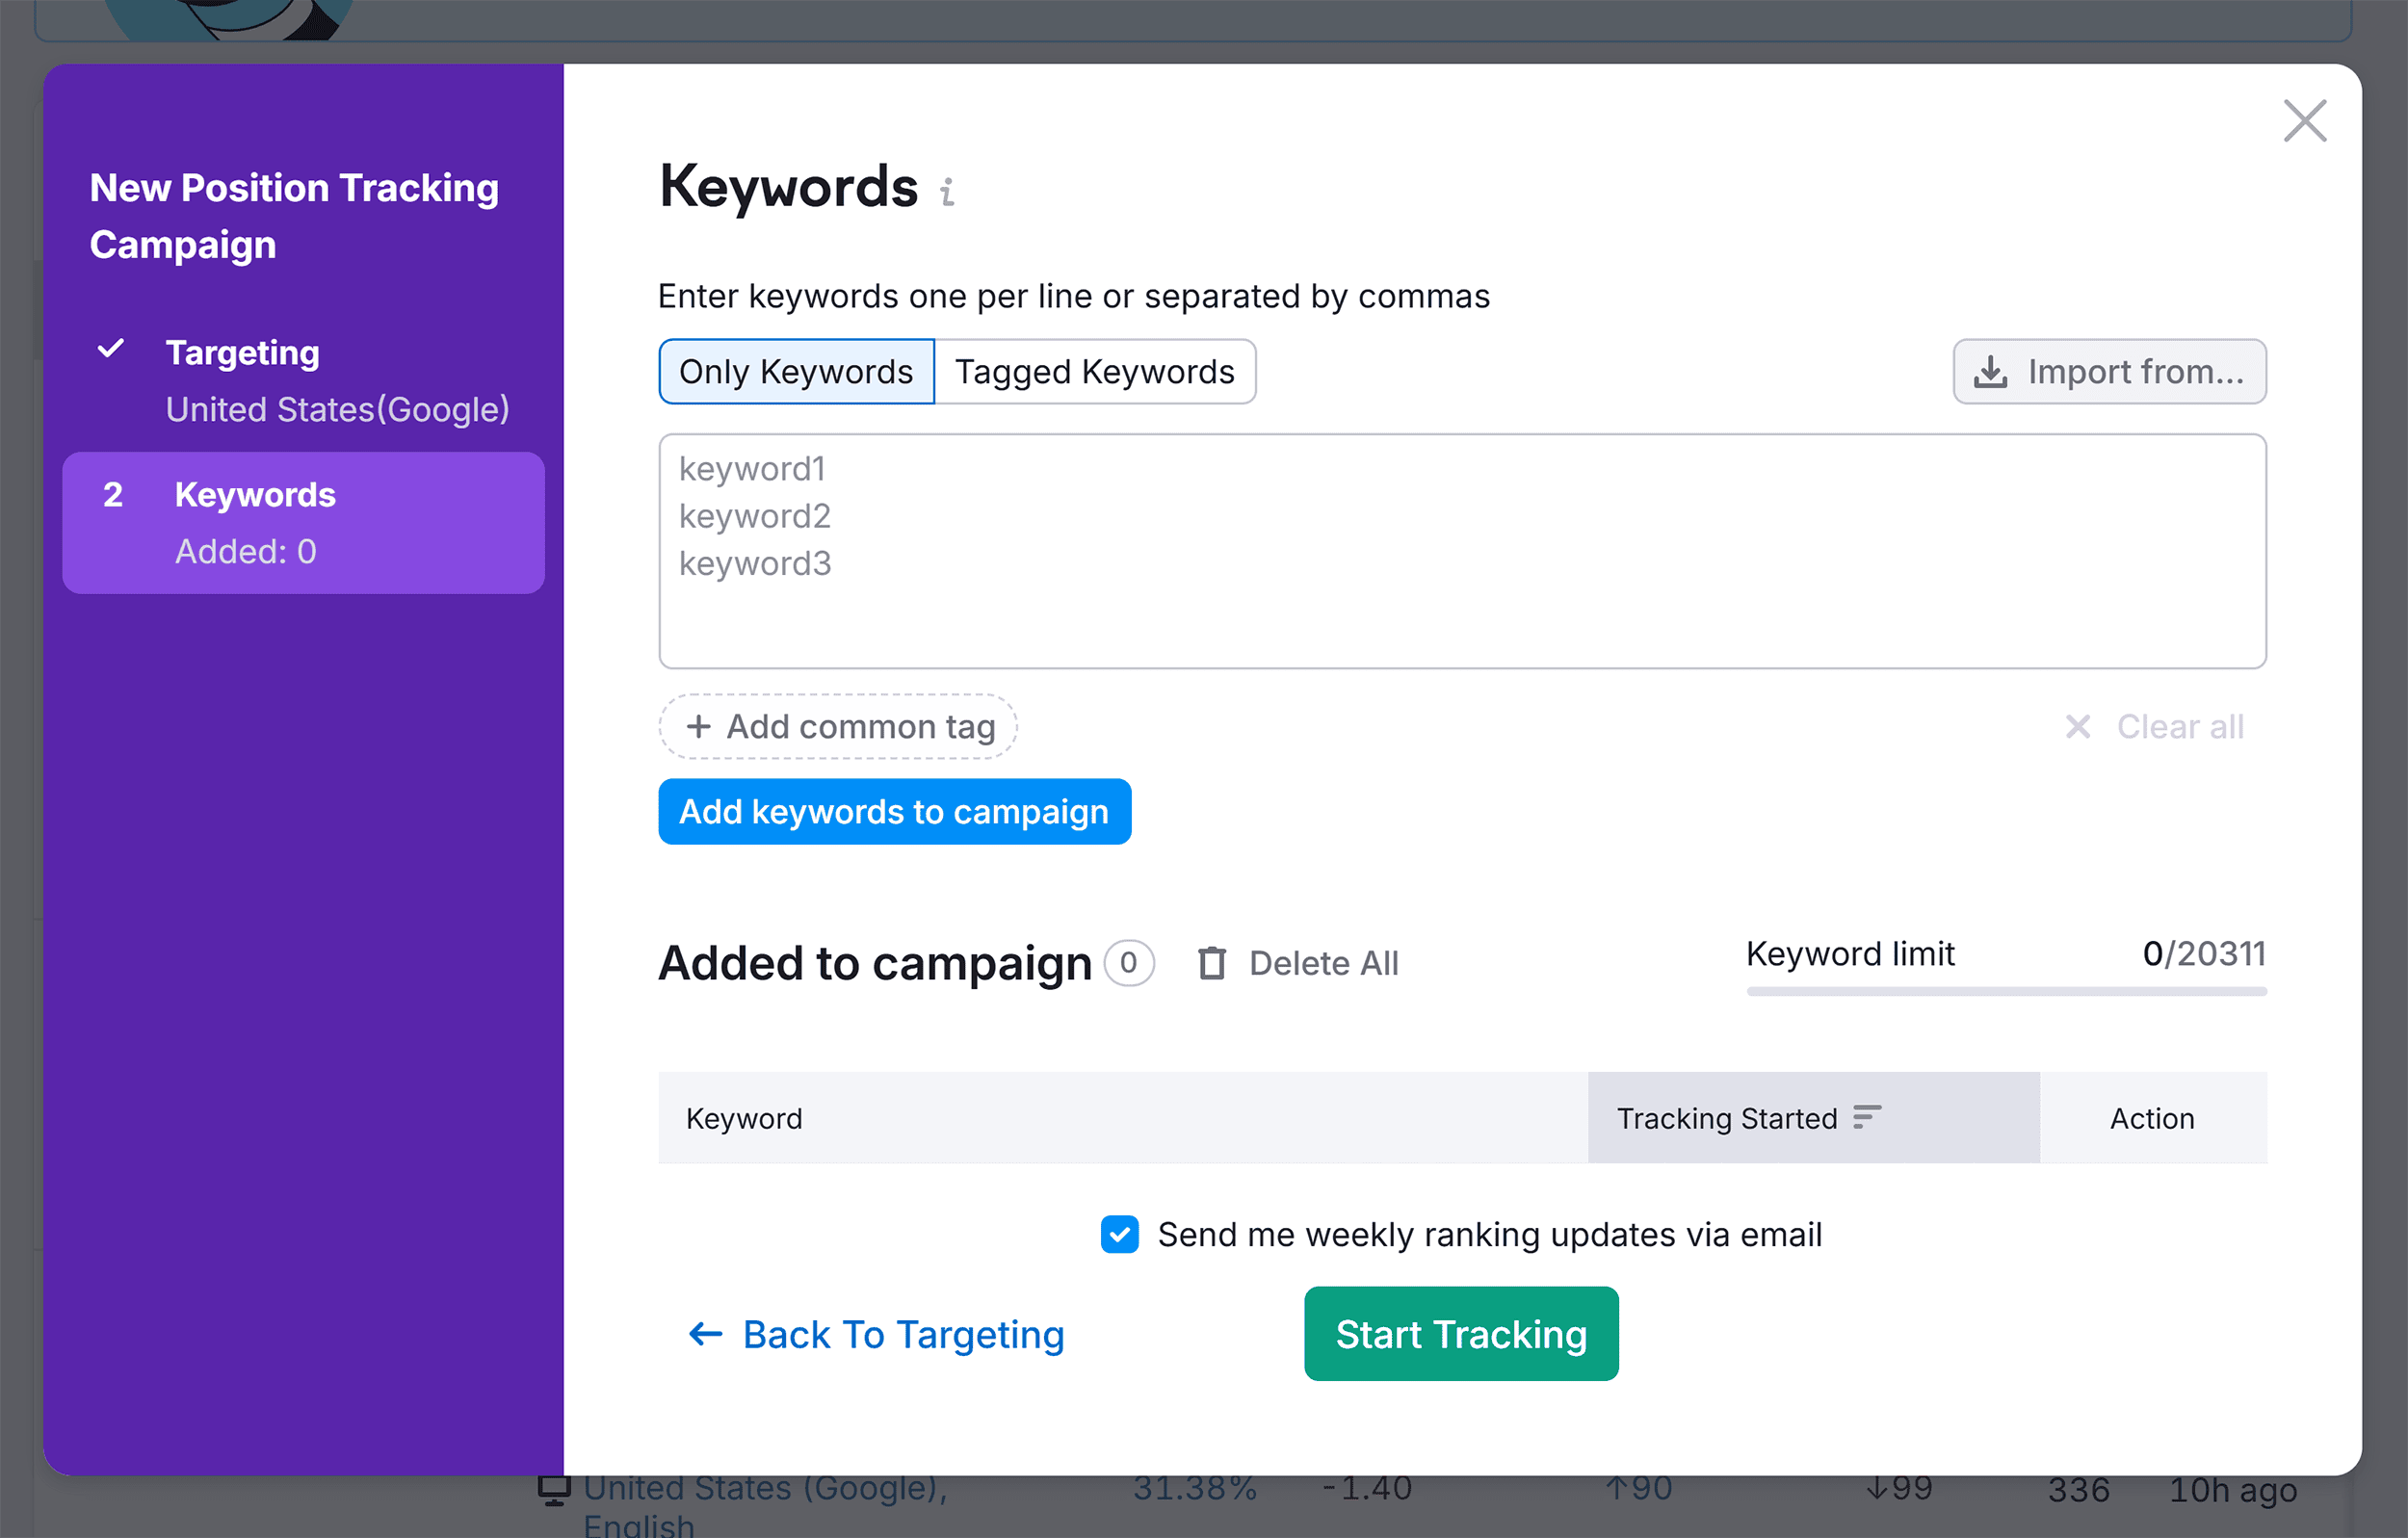
This manual process can be cumbersome for large keyword sets. Tools like Semrush Position Tracking automate this by allowing users to create projects, input domains and target keywords, and then automatically calculate daily ranking data and aggregate it into SoV percentages for the brand and its competitors. It’s crucial to specify the correct geographic location, as search results and thus SoV can vary significantly by region.
Calculating AI Share of Voice
Measuring AI SoV is less standardized but equally vital. A practical approach involves:
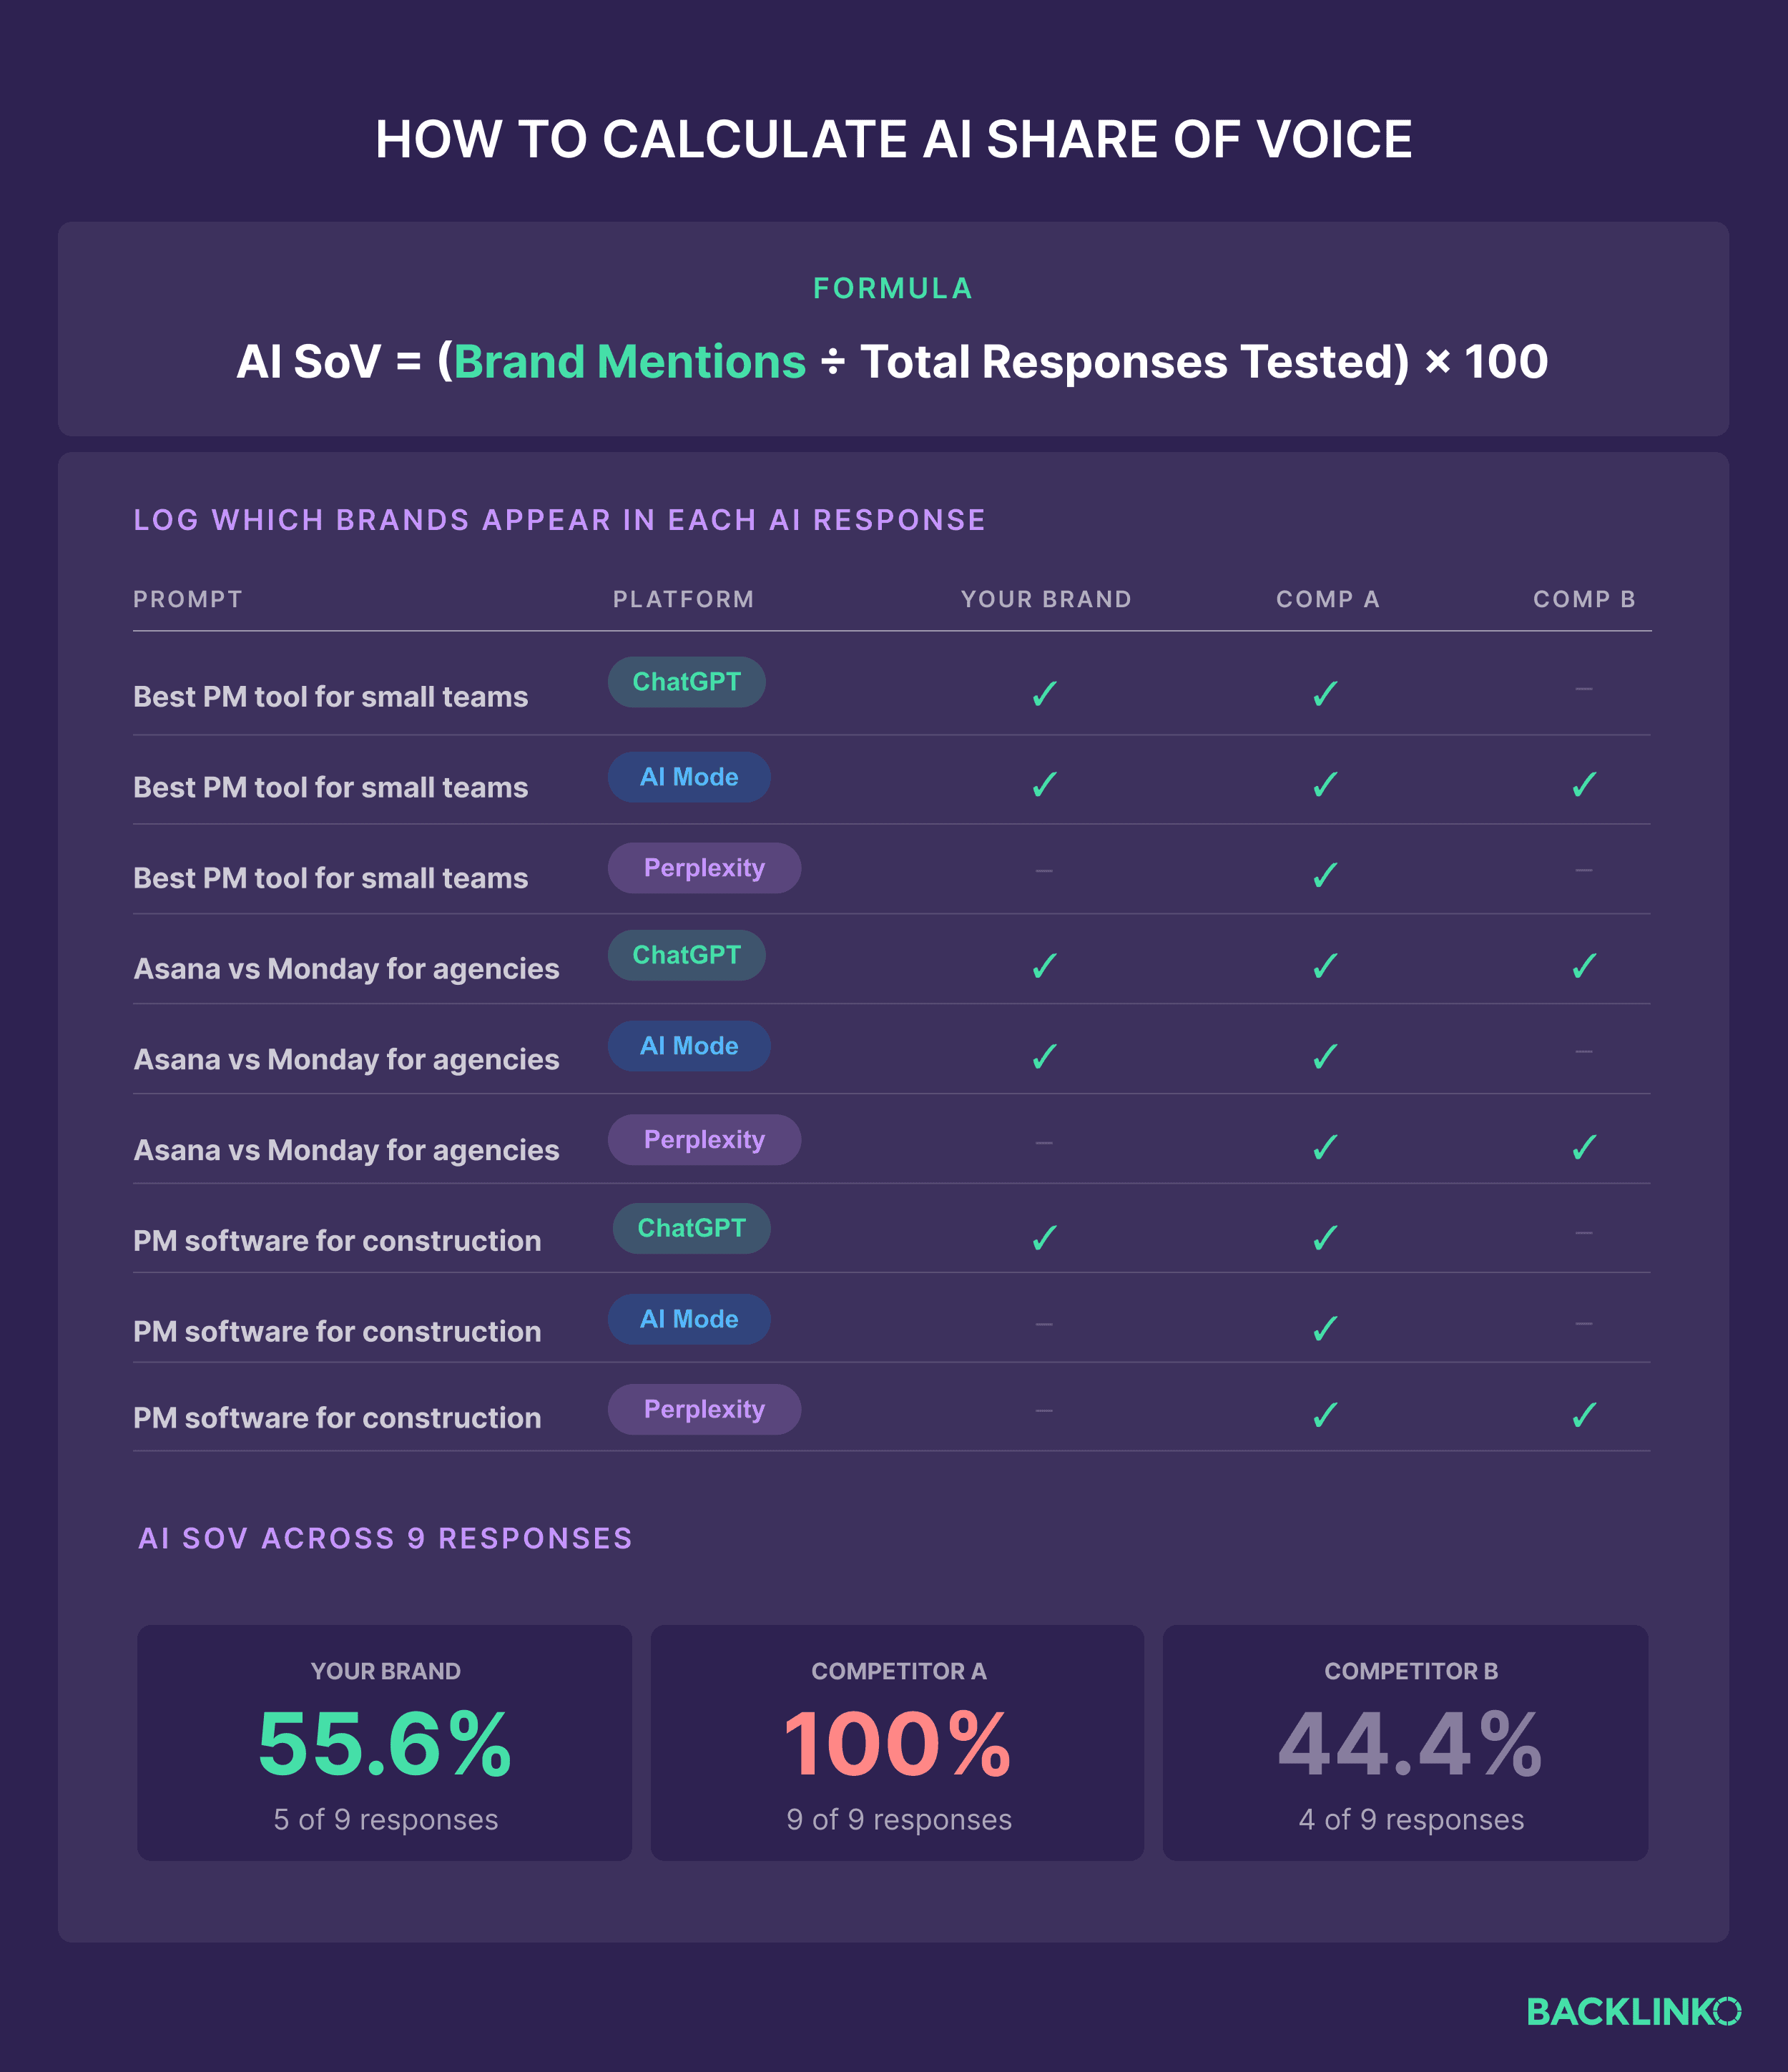
- Prompt Testing: Systematically query LLMs (ChatGPT, Google AI Mode, Perplexity, etc.) with the prompts from your AI library.
- Response Analysis: Record every instance a brand (yours or a competitor’s) is mentioned or explicitly cited in the AI’s response.
- SoV Estimation: Count total mentions/citations for each brand across all tested prompts. Divide each brand’s total by the total number of prompts tested and multiply by 100.
It’s important to note that this manual method provides a directional read, as AI responses can vary by session, phrasing, and platform. Regular testing and trend tracking are essential. For scalability, tools like Semrush’s AI Visibility Toolkit automate this process. By entering a domain and selecting an AI platform, the tool queries hundreds of category-related prompts, analyzing responses for brand mentions, citations, and even sentiment. This provides a dynamic, weighted AI SoV and highlights specific "business drivers" (frequently mentioned topics) where a brand is stronger or weaker compared to competitors.
Interpreting SEO vs. AI Share of Voice
It’s common for SEO SoV and AI SoV to diverge. A brand might have a high SEO SoV due to strong rankings but a low AI SoV if LLMs don’t find its content sufficiently credible or citable. Conversely, a brand with highly authoritative content might win a significant AI SoV even without top organic search rankings. A simple matrix helps in strategic diagnosis:
- High SEO SoV & High AI SoV: Dominance in both traditional and AI search. Focus on maintaining content freshness and expanding into adjacent topics.
- High SEO SoV & Low AI SoV: Ranks well, but LLMs don’t cite the brand. Optimize content for AI by implementing clear chunking, creating citable assets (data, research), and focusing on E-E-A-T (Experience, Expertise, Authoritativeness, Trustworthiness).
- Low SEO SoV & High AI SoV: AI tools cite content despite low organic rankings. Improve SEO fundamentals: title tags, internal linking, site speed, and keyword optimization to leverage AI visibility for organic gains.
- Low SEO SoV & Low AI SoV: Significant visibility gaps. Prioritize creating definitive, well-researched content resources for core topic clusters to build foundational visibility across both search types.
Step 4: Establishing Your Baseline and Tracking Strategic Trends
The final step transforms raw SoV numbers into an ongoing strategic tracking system. This involves creating a baseline dashboard that captures three levels of detail:
- Overall SoV: The brand’s total share of voice across the entire market.
- SoV by Cluster: Performance within each defined topic cluster (e.g., "Agile Methodologies," "Collaboration Tools").
- SoV by Funnel Stage: Visibility at Awareness, Consideration, and Decision stages of the buyer journey.
Once the baseline is established, a consistent tracking cadence is crucial. Monthly monitoring allows for the identification of trends without overreacting to daily fluctuations. Quarterly deep dives are essential for:
- Strategic Reassessment: Evaluating the effectiveness of ongoing initiatives.
- Competitive Analysis: Identifying emerging threats or opportunities.
- Resource Allocation: Adjusting marketing budgets and content strategies based on performance.
This rhythmic tracking ensures that the brand’s digital strategy remains agile and responsive to market shifts, rather than being reactive to short-term noise.
Actionable Strategies to Improve Share of Voice
Not every fluctuation in SoV demands immediate action, but consistent monitoring allows for strategic interventions.
1. Close Critical Visibility Gaps
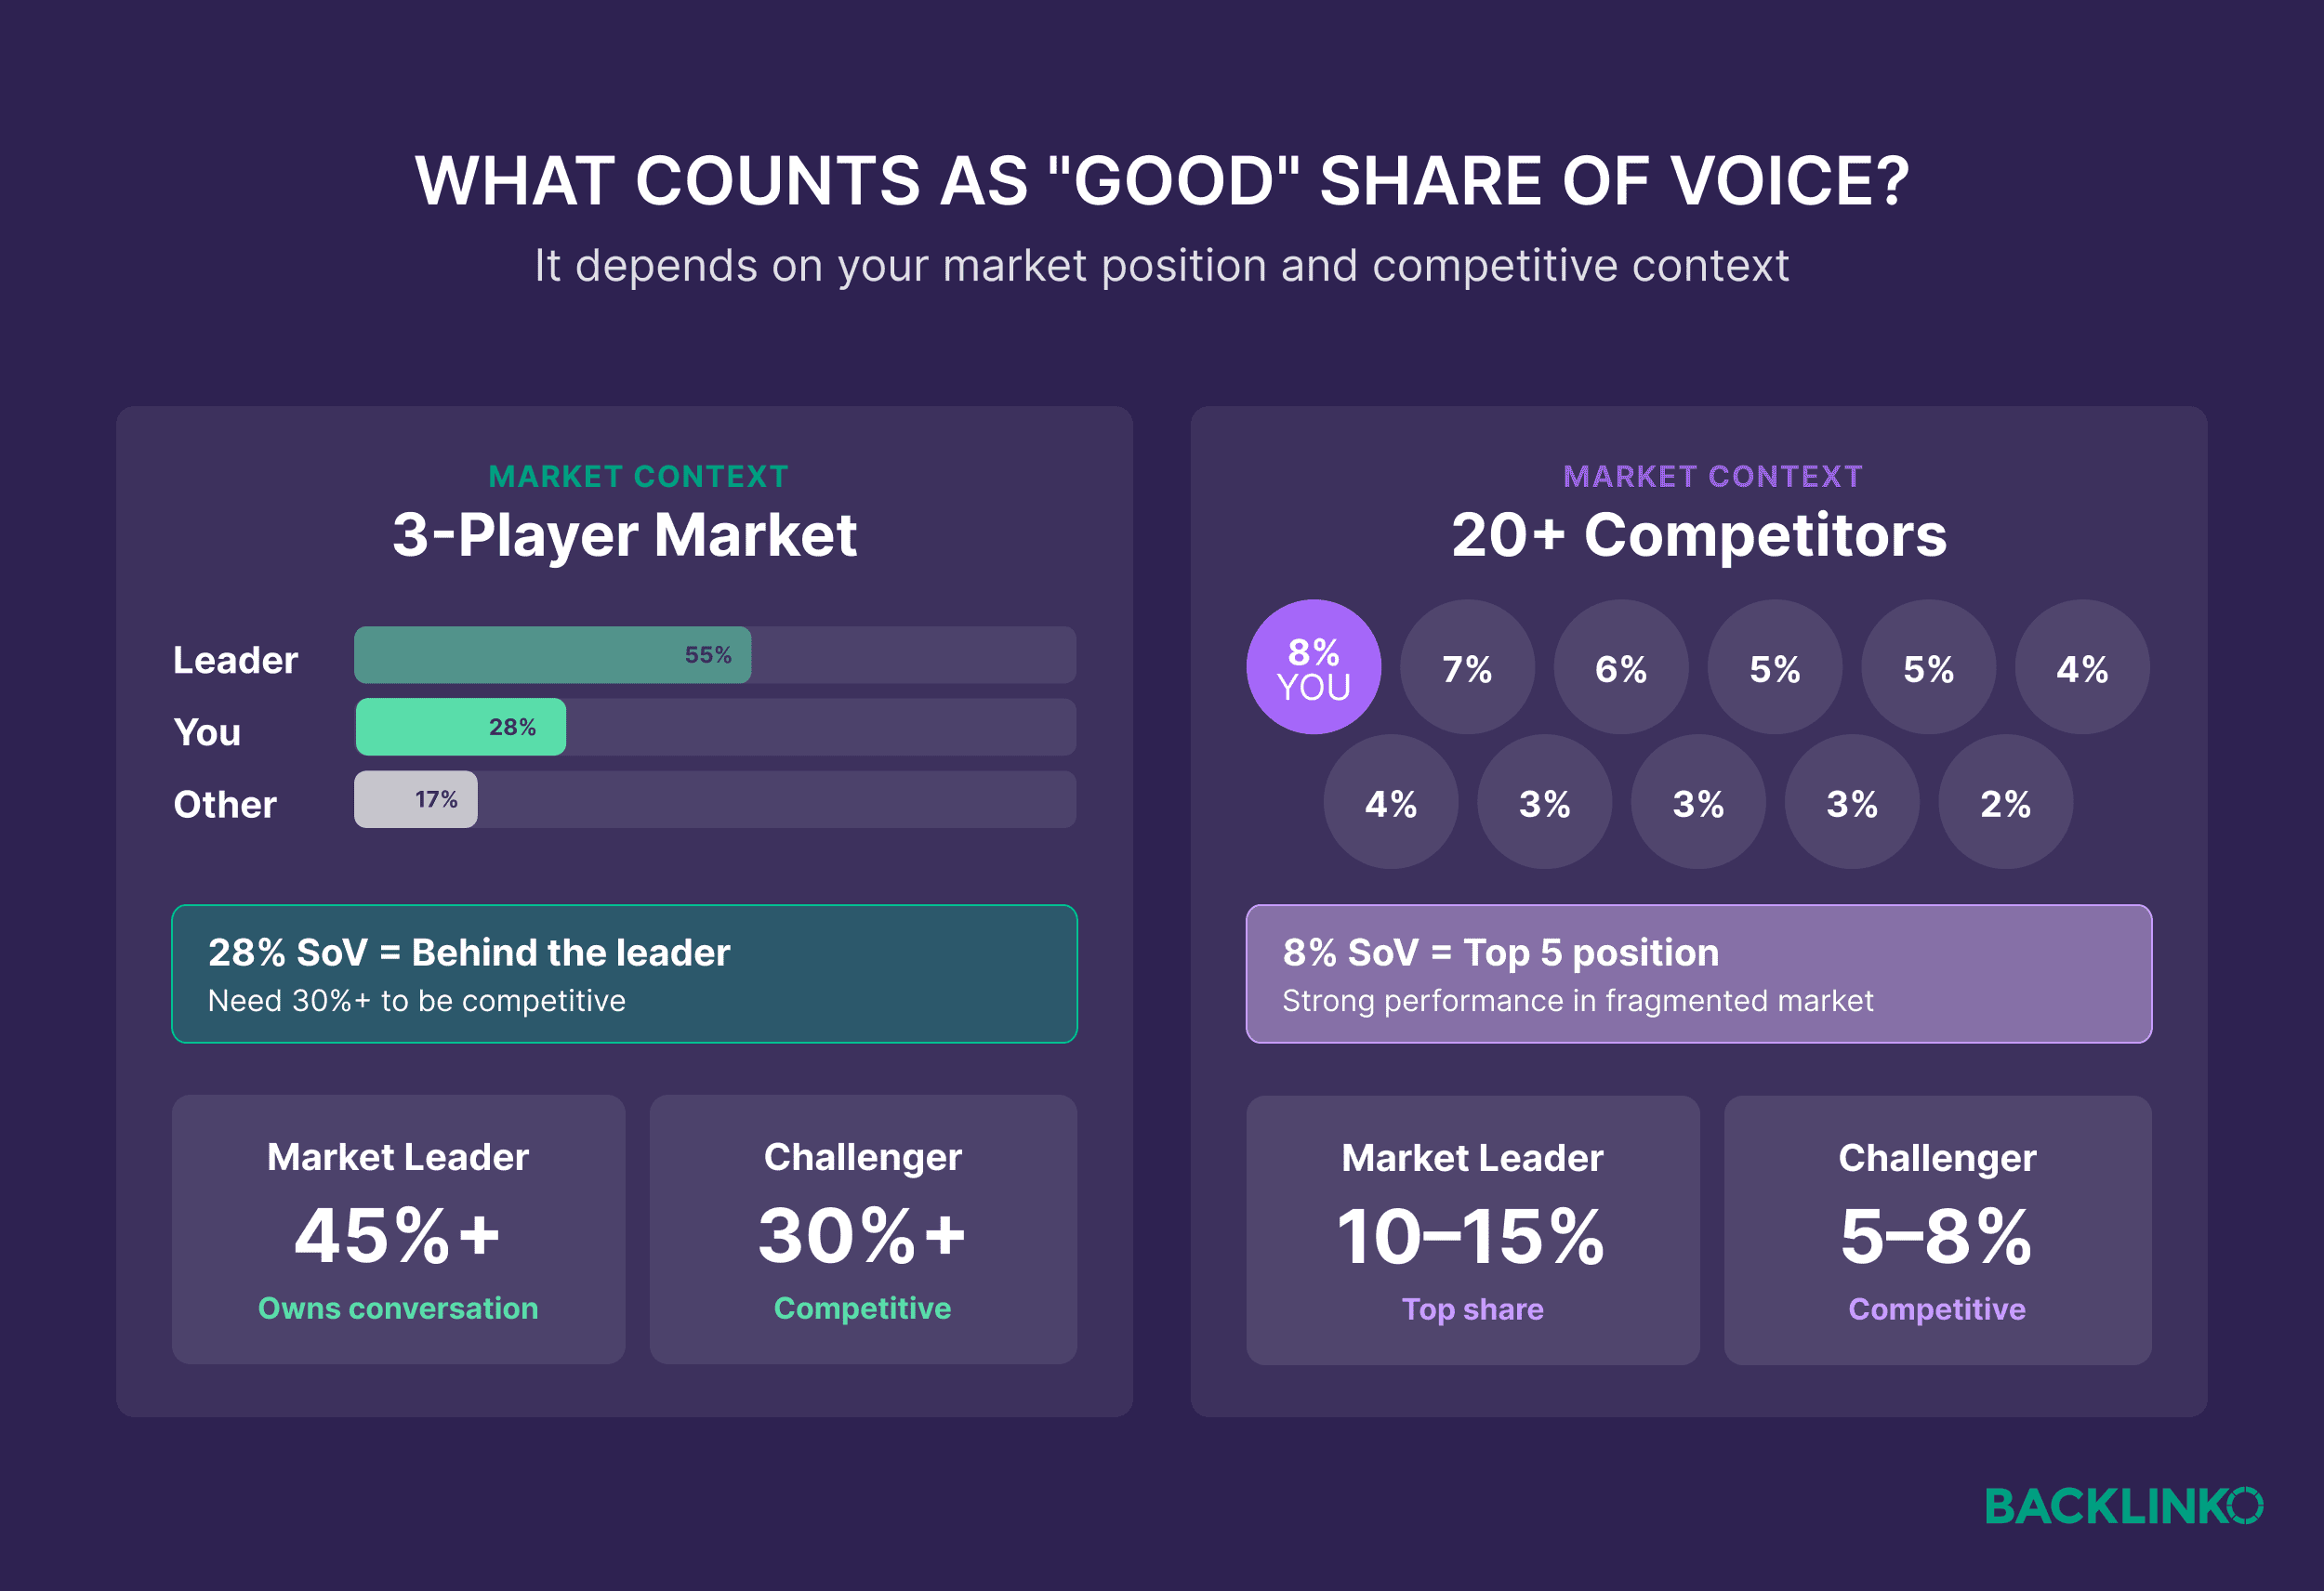
Clusters with less than 10% SoV signify near invisibility, particularly damaging in decision-stage queries. If a brand isn’t present when buyers are actively comparing solutions, it’s not even in the running. Simultaneously, identifying areas where competitors dominate but the brand has a unique value proposition presents a prime opportunity. For example, if a project management tool specializes in serving creative agencies but lacks visibility for "project management for creative teams," this is a clear gap to target.
Potential Solutions:
- Build Topical Authority: Develop comprehensive "pillar pages" supported by multiple detailed articles for major business themes. These content hubs, when backed by strong backlinks, establish credibility and visibility across an entire query cluster.
- Target Comparison Content: Create dedicated "Brand X vs. Competitor Y" pages and comprehensive buyer’s guides to directly address decision-stage queries.
2. Solve Efficiency Problems
A high SoV in a low-converting cluster signals an efficiency problem. If a brand dominates "what is project management" but only 1% of that traffic converts, resources might be misallocated, allowing competitors to capture high-intent buyers.
Potential Solutions:

- Reallocate Resources: Shift budget and content creation efforts from high-awareness, low-conversion content to bottom-of-funnel assets like detailed comparison charts, case studies, and ROI calculators that target buyers ready to evaluate solutions.
- Optimize Existing Content: Update current high-SoV but low-converting pages with stronger calls to action, clear product benefits, and competitive differentiators.
3. Address Competitive Threats
Vigilance over competitors gaining ground in the brand’s strong clusters is paramount. A competitor’s 5% SoV increase in a key cluster can be an early warning sign of an encroaching market share.
Potential Solutions:
- Optimize Review Profiles: If competitors are winning on review sites, proactively manage and optimize brand profiles on platforms like G2 and Capterra, encouraging satisfied customers to leave reviews.
- Proactive Community Engagement: Actively participate in relevant online communities (Reddit, Slack, LinkedIn groups) where competitors are visible, positioning the brand as a helpful resource and thought leader.
- Content Refresh & Expansion: Continuously update and expand existing high-performing content to maintain its relevance and authority, anticipating and countering competitor content strategies.
Prioritize Based on Effort vs. Impact
Not all SoV gaps are created equal. Prioritization should focus on opportunities that most effectively move the revenue pipeline.
- High Impact, Low Effort: These are often quick wins, such as optimizing existing high-ranking pages for AI snippets, updating outdated comparison content, or generating reviews from existing customer lists.
- Low Impact, Low Effort: These might include minor content tweaks or engaging in low-volume forums; while easy, they offer minimal strategic return.
- High Impact, High Effort: These require significant investment but offer substantial long-term gains, such as building entirely new topical authority hubs, launching comprehensive competitor take-down campaigns, or developing proprietary data/research to become a primary AI citation source.
- Low Impact, High Effort: These should generally be avoided, as they consume resources without delivering meaningful results.
Making SoV Your 2026 North Star

In an increasingly fragmented and AI-driven digital landscape, Share of Voice transcends traditional metrics to offer a comprehensive understanding of a brand’s presence across every critical touchpoint where buyers engage. By systematically defining the competitive landscape, building rich keyword and prompt libraries, accurately calculating SoV across both organic and AI search, and establishing robust tracking systems, brands can gain unparalleled insights into their market influence. Translating these insights into strategic actions – whether closing visibility gaps, addressing efficiency issues, or countering competitive threats – is crucial for not just maintaining, but expanding market share. Embracing SoV as a core KPI positions brands to navigate the complexities of modern digital discovery, ensuring their message resonates where it matters most, and ultimately, drives sustainable growth.
Backlinko is owned by Semrush. We’re still obsessed with bringing you world-class SEO insights, backed by hands-on experience. Unless otherwise noted, this content was written by either an employee or paid contractor of Semrush Inc.