The Ultimate Guide to Social Media Dashboards: Types, Metrics, and Best Tools for 2026

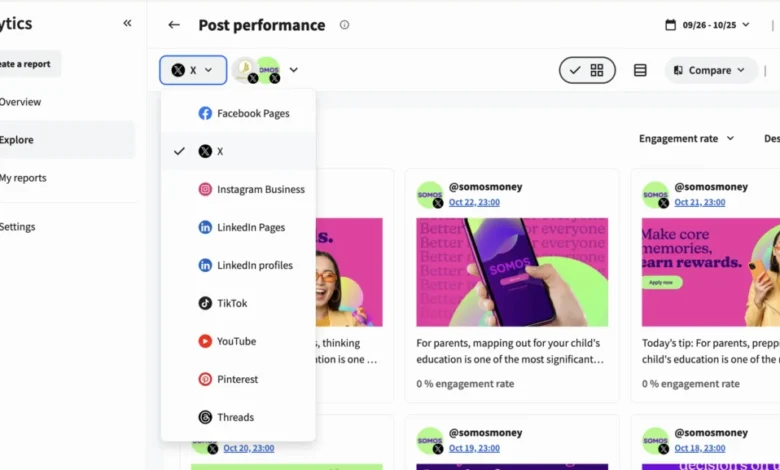
As global investments in digital marketing reach unprecedented levels—with United States social ad spending alone projected to surpass $121 billion by 2026—enterprise marketing organizations and multinational agencies face an escalating crisis of complexity. Managing distinct presences across Instagram, LinkedIn, Facebook, TikTok, and X without centralized oversight has transformed basic performance tracking into a formidable administrative burden. Modern social media dashboards have consequently emerged as indispensable enterprise infrastructure, serving as unified interfaces that consolidate disparate metrics into single panes of glass for real-time tracking, advanced analysis, and executive reporting.

The Operational Evolution of Cross-Platform Analytics
Historically, digital marketing teams wasted valuable hours logging into native analytics applications on individual social platforms, manually exporting disparate CSV files, and attempting to reconcile conflicting data structures within static spreadsheets. This fragmented approach not only drained operational efficiency but also delayed strategic responses to viral trends, consumer crises, or unexpected algorithm adjustments.
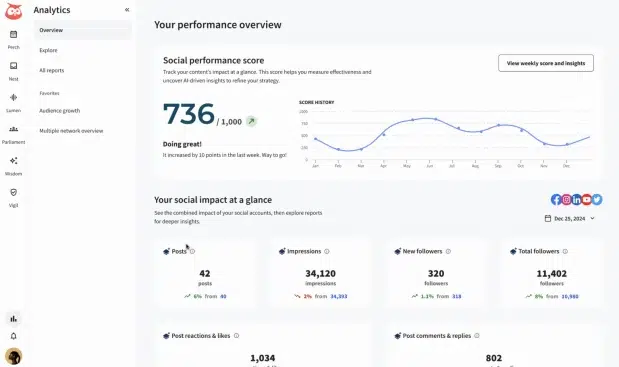
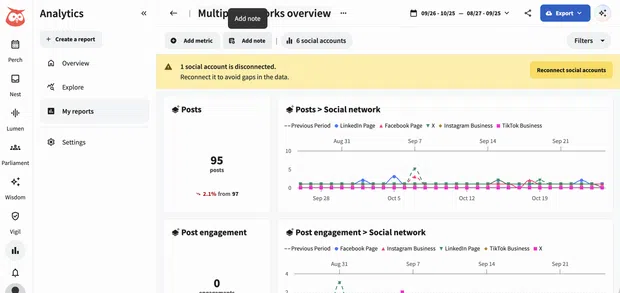
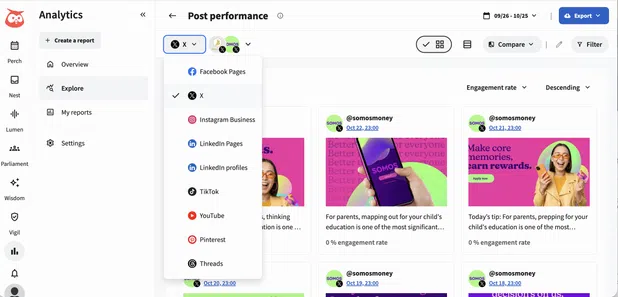
Today’s enterprise dashboards solve this friction by offering near-real-time data ingestion, customizable visualizations, and granular filtering capabilities. Systems like Hootsuite Social OS have redefined the category by bridging the gap between content publishing, social listening, and cross-platform analytics. Rather than viewing reporting as a retrospective chore performed at the end of a quarter, contemporary marketing divisions utilize centralized dashboards to drive agile decision-making, optimize resource allocation, and protect brand equity on a global scale.

Categorizing the Four Core Types of Social Media Dashboards
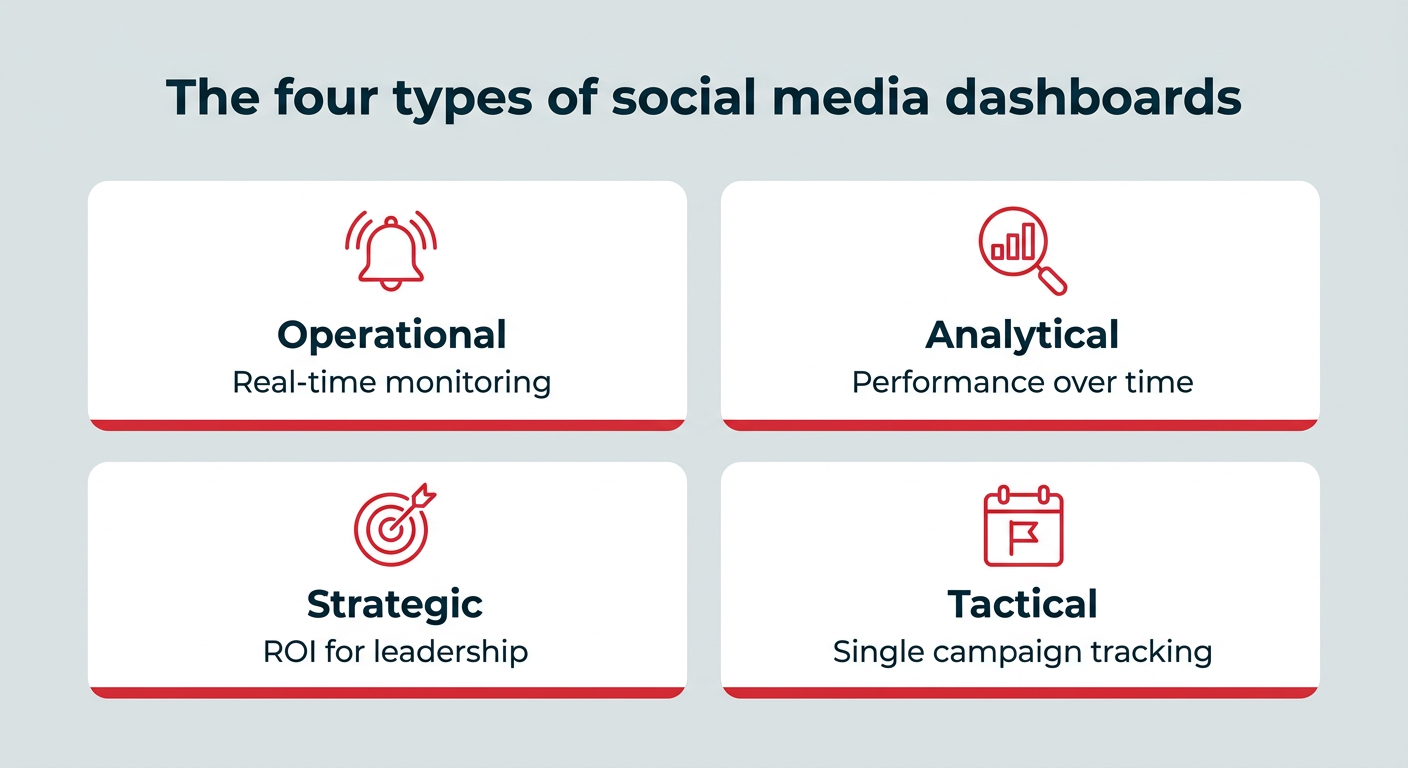
To prevent data overload and maintain analytical clarity, industry experts categorize social media dashboards into four distinct functional types. Understanding these classifications ensures that organizations deploy the correct metrics for specific operational objectives:
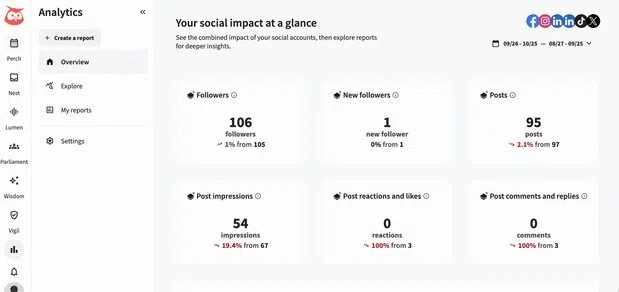
- Operational Dashboards: Designed primarily for social media coordinators, community managers, and customer care representatives, these interfaces monitor live, real-time activity. They track incoming mentions, customer service inquiries, and immediate response requirements to maintain high standards of digital engagement.
- Analytical Dashboards: Utilized by social media managers and data analysts, these systems evaluate content efficacy and audience behavior over extended time horizons. They uncover granular trends regarding content formats, optimal posting times, and audience segmentation.
- Strategic Dashboards: Tailored for Chief Marketing Officers, Vice Presidents of Marketing, and senior directors, strategic dashboards aggregate high-level key performance indicators (KPIs). They focus heavily on return on investment (ROI), revenue attribution, and long-term progress toward corporate business goals.
- Tactical Dashboards: Deployed by campaign managers and paid media specialists, tactical views track specific marketing initiatives from their initial launch to final wrap-up, measuring ad spend efficiency and immediate conversion pathways.
Overcoming Enterprise Measurement Challenges in a Flat Budget Environment
The necessity for robust dashboard reporting is further heightened by macroeconomic pressures. According to recent Gartner research, CMO marketing budgets have flatlined at approximately 7.8% of overall company revenue, with 59% of marketing leaders reporting insufficient financial resources to fully execute their strategic visions. Furthermore, while marketing leaders allocate an average of 15.3% of their constrained budgets toward artificial intelligence capabilities, only 30% of organizations feel adequately prepared to scale those technologies effectively.
In this climate of heightened accountability, proving social media ROI to executive leadership is paramount. Modern dashboards enable marketing teams to present performance metrics within rich historical contexts, shifting the narrative from isolated monthly statistics to multi-quarter trend lines. By connecting social engagement metrics directly to downstream business outcomes—such as verified lead generation, customer acquisition cost (CAC), and pipeline contribution—marketing leaders can successfully justify budget allocations and secure additional resources for digital expansion.
Mapping Metrics to Strategic Organizational Goals

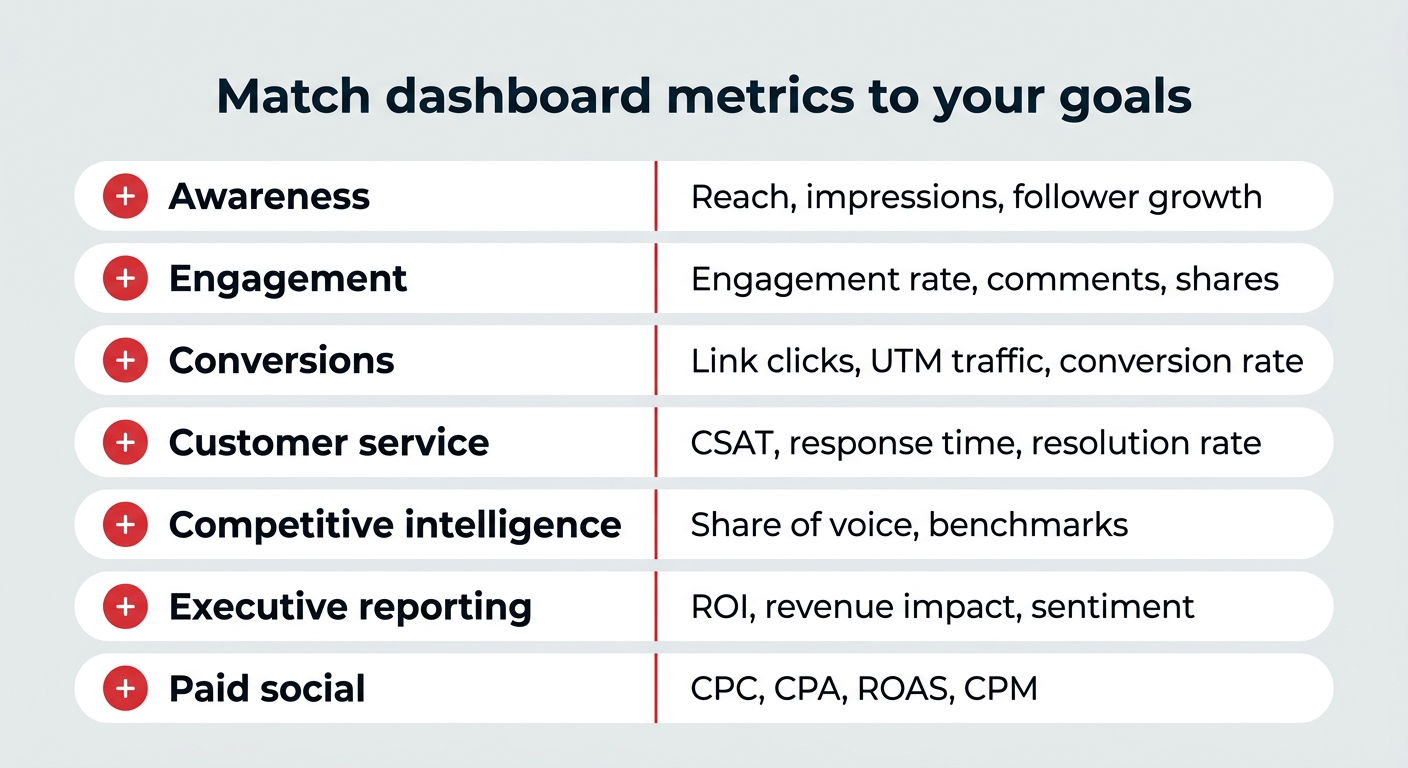
A pervasive error among growing marketing teams is the adoption of vanity metrics—such as raw follower counts or unfiltered impression volumes—that fail to correlate with tangible business value. A professionally structured dashboard aligns specific organizational goals with corresponding performance indicators:
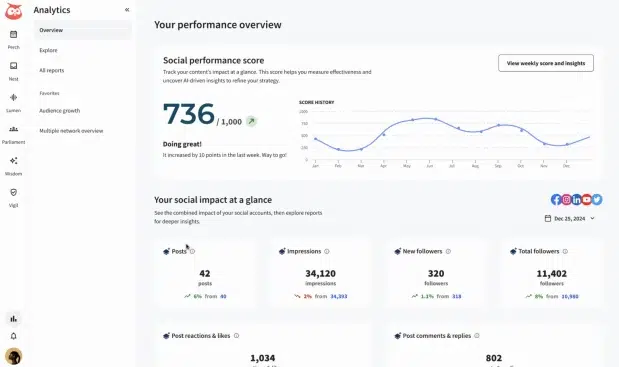
- Brand Awareness: Measured via reach, impression growth, and net follower acquisition over time. Enterprise teams utilize these metrics to gauge the macroscopic impact of multi-region brand campaigns.
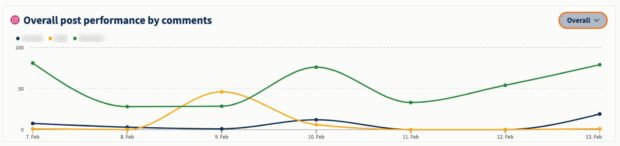
- Engagement and Content Performance: Tracked through engagement rates, post-level interactions (likes, shares, comments, saves), and media format comparisons. These data points reflect true audience resonance and inform iterative content calendar adjustments.
- Conversions and Traffic: Evaluated via unique link clicks, UTM-parameterized traffic, and downstream conversion rates. Integrating social dashboards with Customer Relationship Management (CRM) platforms and Google Analytics is essential for full-funnel attribution.
- Customer Service Excellence: Monitored through Customer Satisfaction (CSAT) scores, average response times, and issue resolution rates. As automated customer service tools expand, monitoring service quality remains vital to prevent customer frustration.
- Competitive Intelligence: Assessed via share of voice, competitor engagement benchmarks, and brand sentiment analysis, providing crucial context for strategic positioning and market gap identification.
- Paid Social Advertising: Measured through Cost Per Click (CPC), Cost Per Acquisition (CPA), Return on Ad Spend (ROAS), and Cost Per Mille (CPM), ensuring paid campaigns generate positive financial yields prior to budget depletion.
Evaluating the Leading Dashboard Solutions on the Market
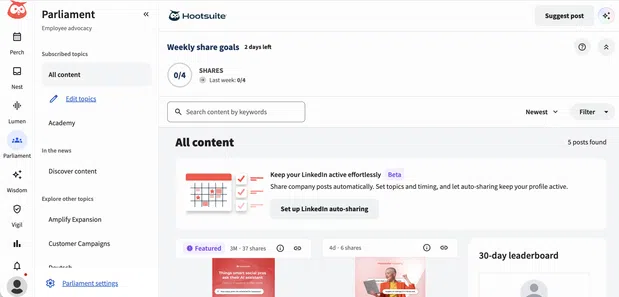
Organizations seeking to implement or upgrade their reporting infrastructure must weigh the trade-offs between custom-built tools and integrated enterprise suites. The current market features several prominent platforms tailored to distinct operational needs:
- Hootsuite Social OS: Ideal for enterprise marketing teams and agencies that require publishing, social listening, customer care, and advanced reporting housed within a single ecosystem. It features pre-built cross-platform templates and AI-powered analytical insights, with standard tiers beginning at $99 per user per month.
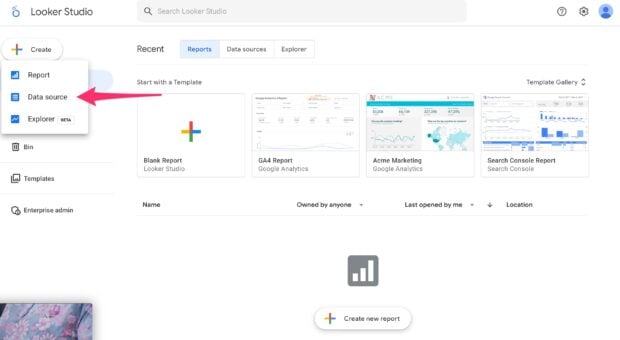
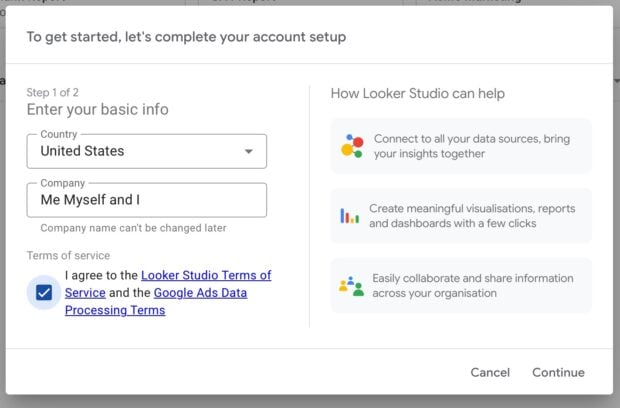
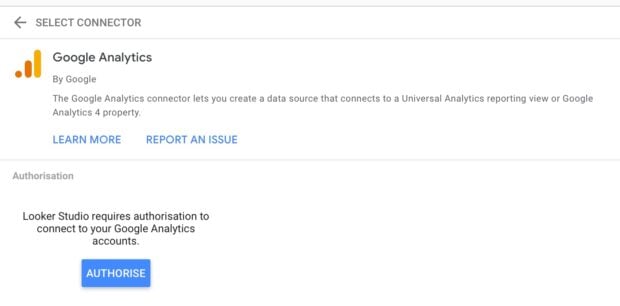
- Google Looker Studio: The premier choice for budget-conscious organizations seeking fully customizable reports built on Google Analytics 4 (GA4) data. While free to use, it demands significant manual setup, ongoing maintenance, and internal technical expertise to manage API updates.
- Klipfolio: Suited for advanced data analysts seeking granular control over custom metric formulas and complex multi-source data integration.
- Databox: Best for marketing teams prioritizing overarching goal tracking and automated performance alerts across disparate marketing software stacks.
- DashThis and Whatagraph: Highly specialized reporting tools optimized for marketing agencies requiring automated, white-labeled, and visually polished recurring client reporting at scale.
Strategic Implications and Future Outlook
As the digital ecosystem grows increasingly saturated and programmatic ad spending marches toward projected multi-billion-dollar milestones, the competitive advantage will belong to organizations capable of translating raw social data into immediate, strategic action. Whether an enterprise chooses the comprehensive automation of an integrated suite like Hootsuite Social OS or the bespoke customisation of a free platform like Looker Studio, the fundamental mandate remains unchanged.
Dashboards are no longer passive repositories for vanity charts; they are active operational command centers. By bridging the gap between organic publishing, paid advertising, social listening, and customer care, centralized reporting platforms empower marketing leaders to navigate budget constraints, demonstrate undeniable financial accountability, and secure sustained organizational growth in an increasingly data-driven global economy.