The Evolving Imperative of Share of Voice: Navigating Brand Visibility in the Age of AI and Fragmented Digital Landscapes

Modern analytics dashboards, while adept at tracking traditional metrics like website clicks, often fail to provide a comprehensive understanding of a brand’s true market presence. In today’s dynamic digital ecosystem, a significant portion of brand visibility can occur beyond direct traffic, leaving marketers with an incomplete picture. Instances where a potential customer encounters an AI-generated answer featuring a competitor, or scrolls through an online community discussion where a brand is conspicuously absent, represent critical moments of lost visibility that are rarely captured by conventional traffic data. This growing blind spot underscores the critical need for a more holistic measurement approach: Share of Voice (SoV).

Understanding Share of Voice in the Digital Era
Share of Voice is a sophisticated metric designed to quantify a brand’s visibility relative to its competitors across all channels where consumers actively research, engage, and make purchasing decisions. While historically rooted in tracking advertising spend, SoV has evolved significantly to encompass a broader spectrum of digital touchpoints, including organic search, AI-powered search, social media, online review platforms, and niche community forums. In essence, SoV reveals the percentage of market conversation or attention a brand commands within its category, directly juxtaposed against its rivals.
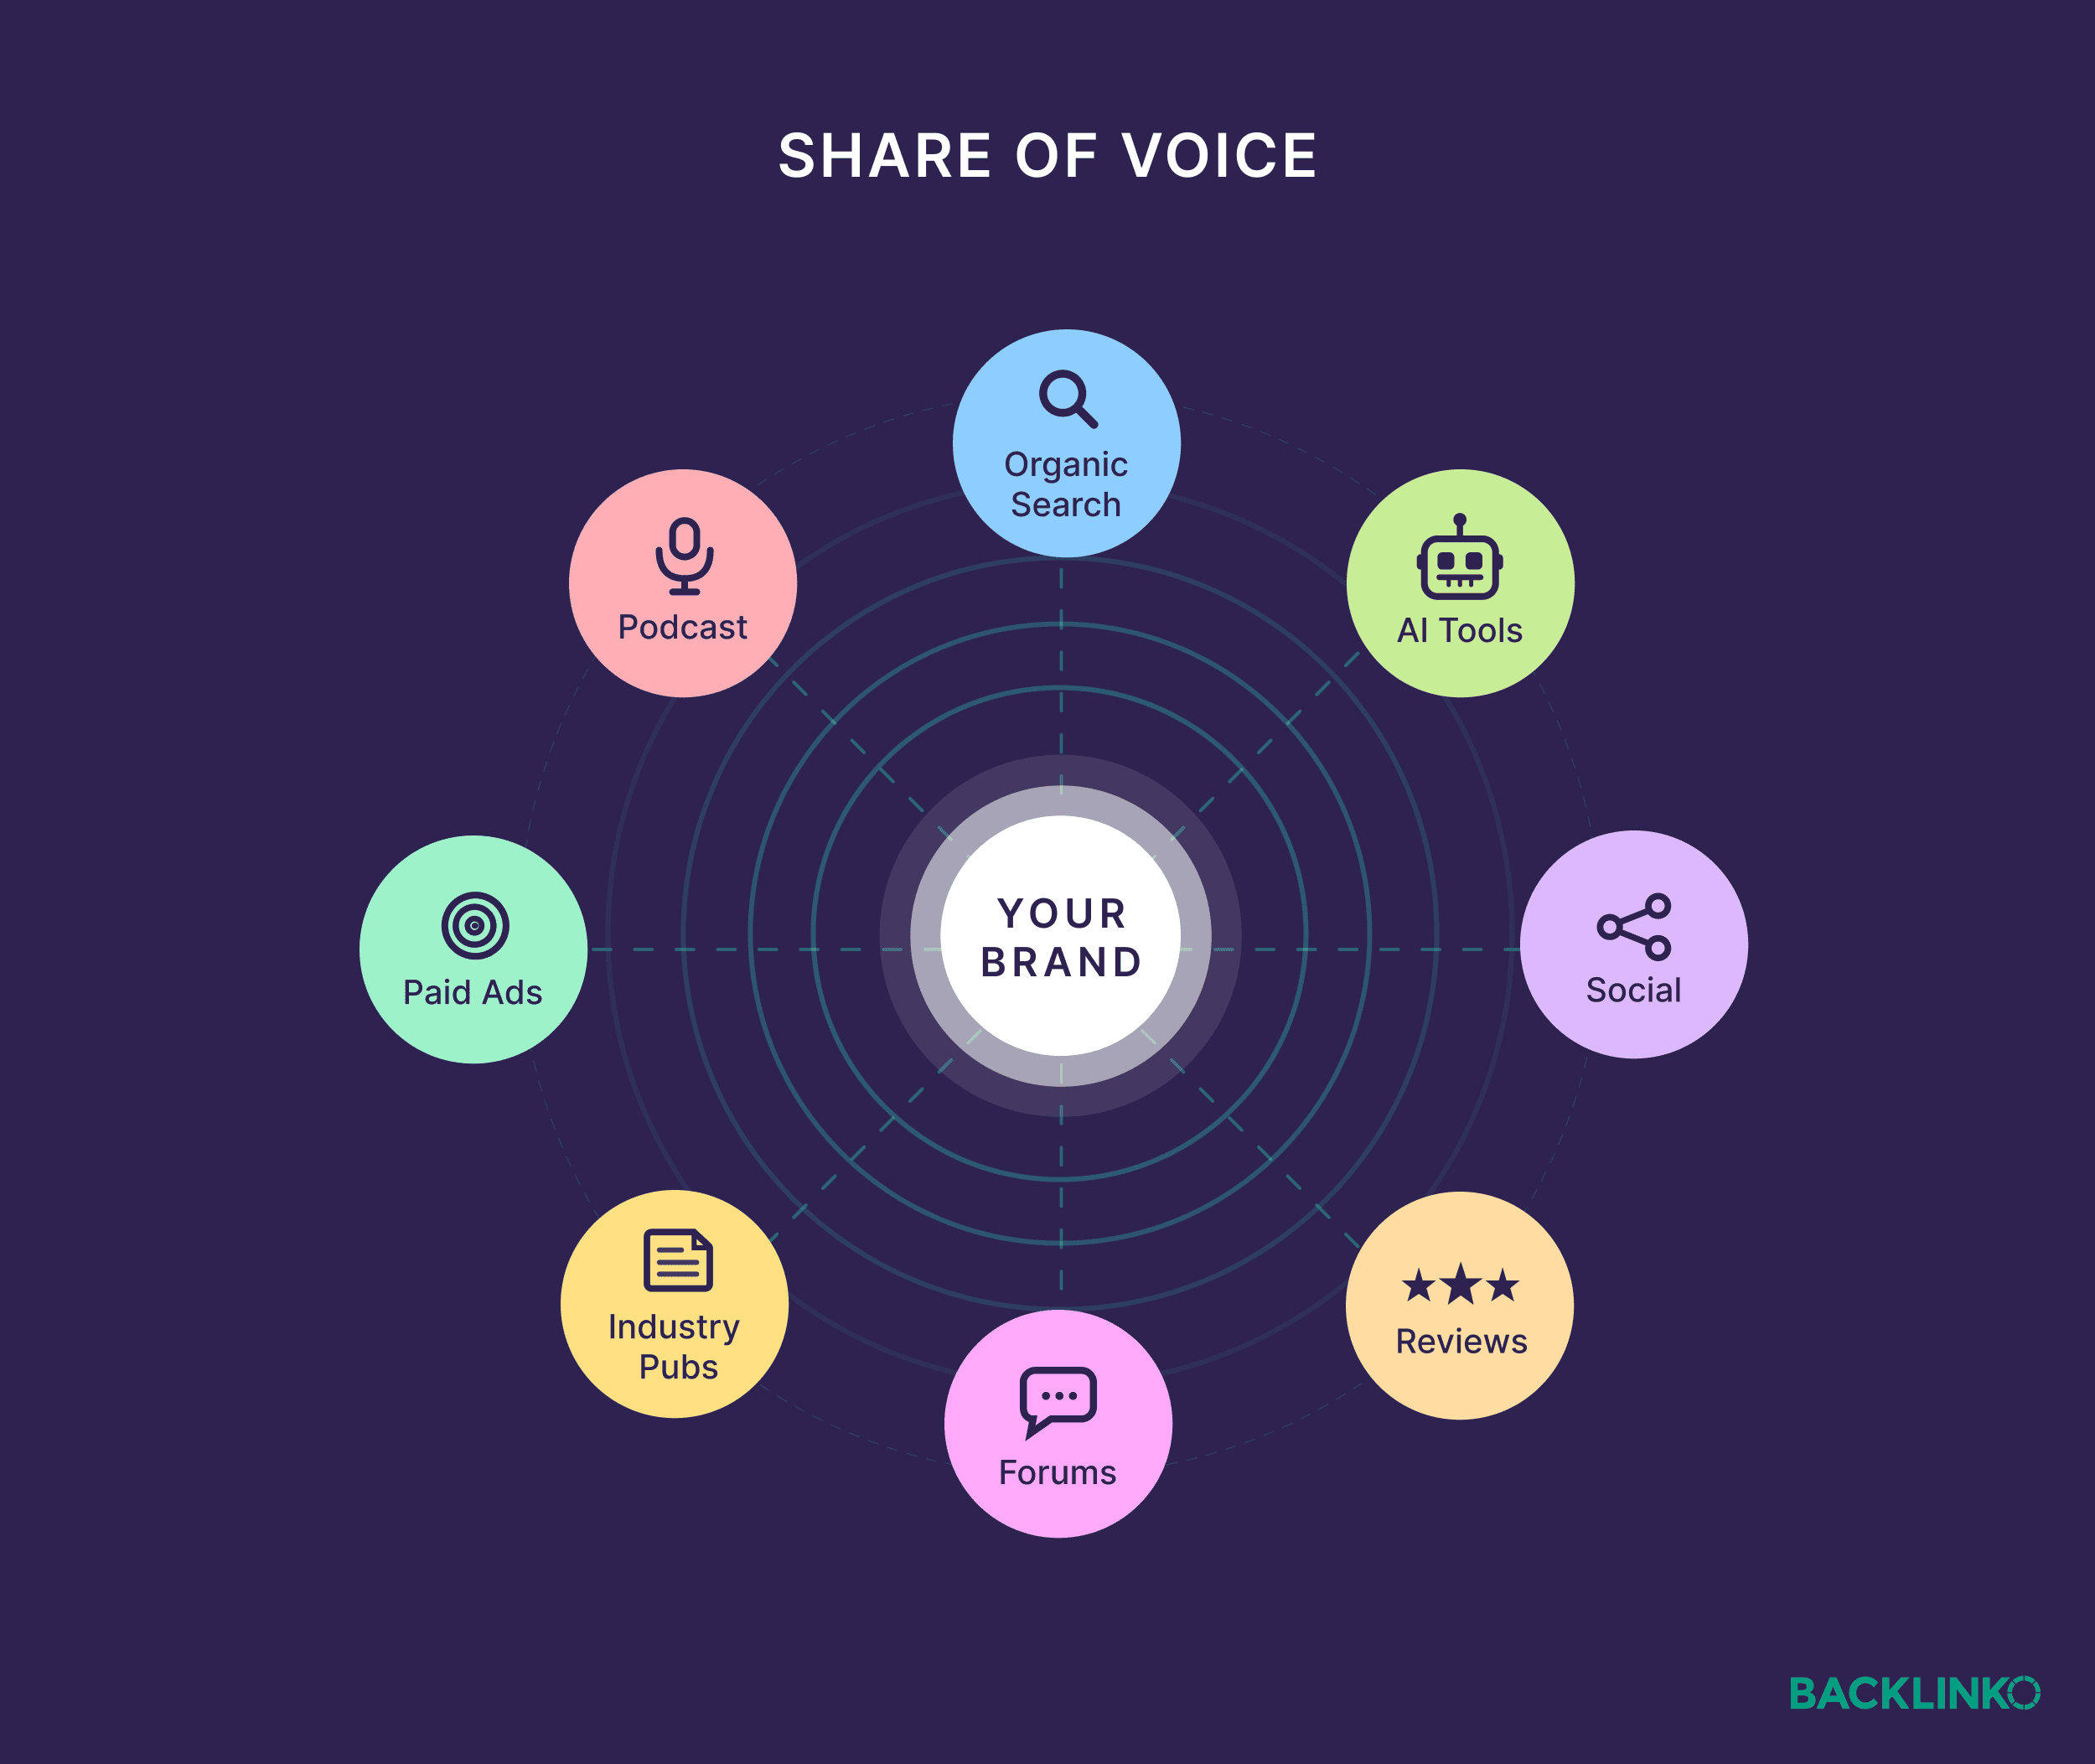
While SoV’s scope spans diverse channels, strategic focus often begins with search – both traditional organic search and the rapidly expanding realm of AI search. This prioritization stems from search’s unique position as a channel where buyers exhibit the strongest purchase intent, and its relative ease of competitive measurement compared to other, more diffuse platforms. This guide specifically delves into the methodologies for accurately measuring SoV within these critical search environments and translating those insights into actionable business strategies.
Defining "Good" Share of Voice: Beyond the Benchmark
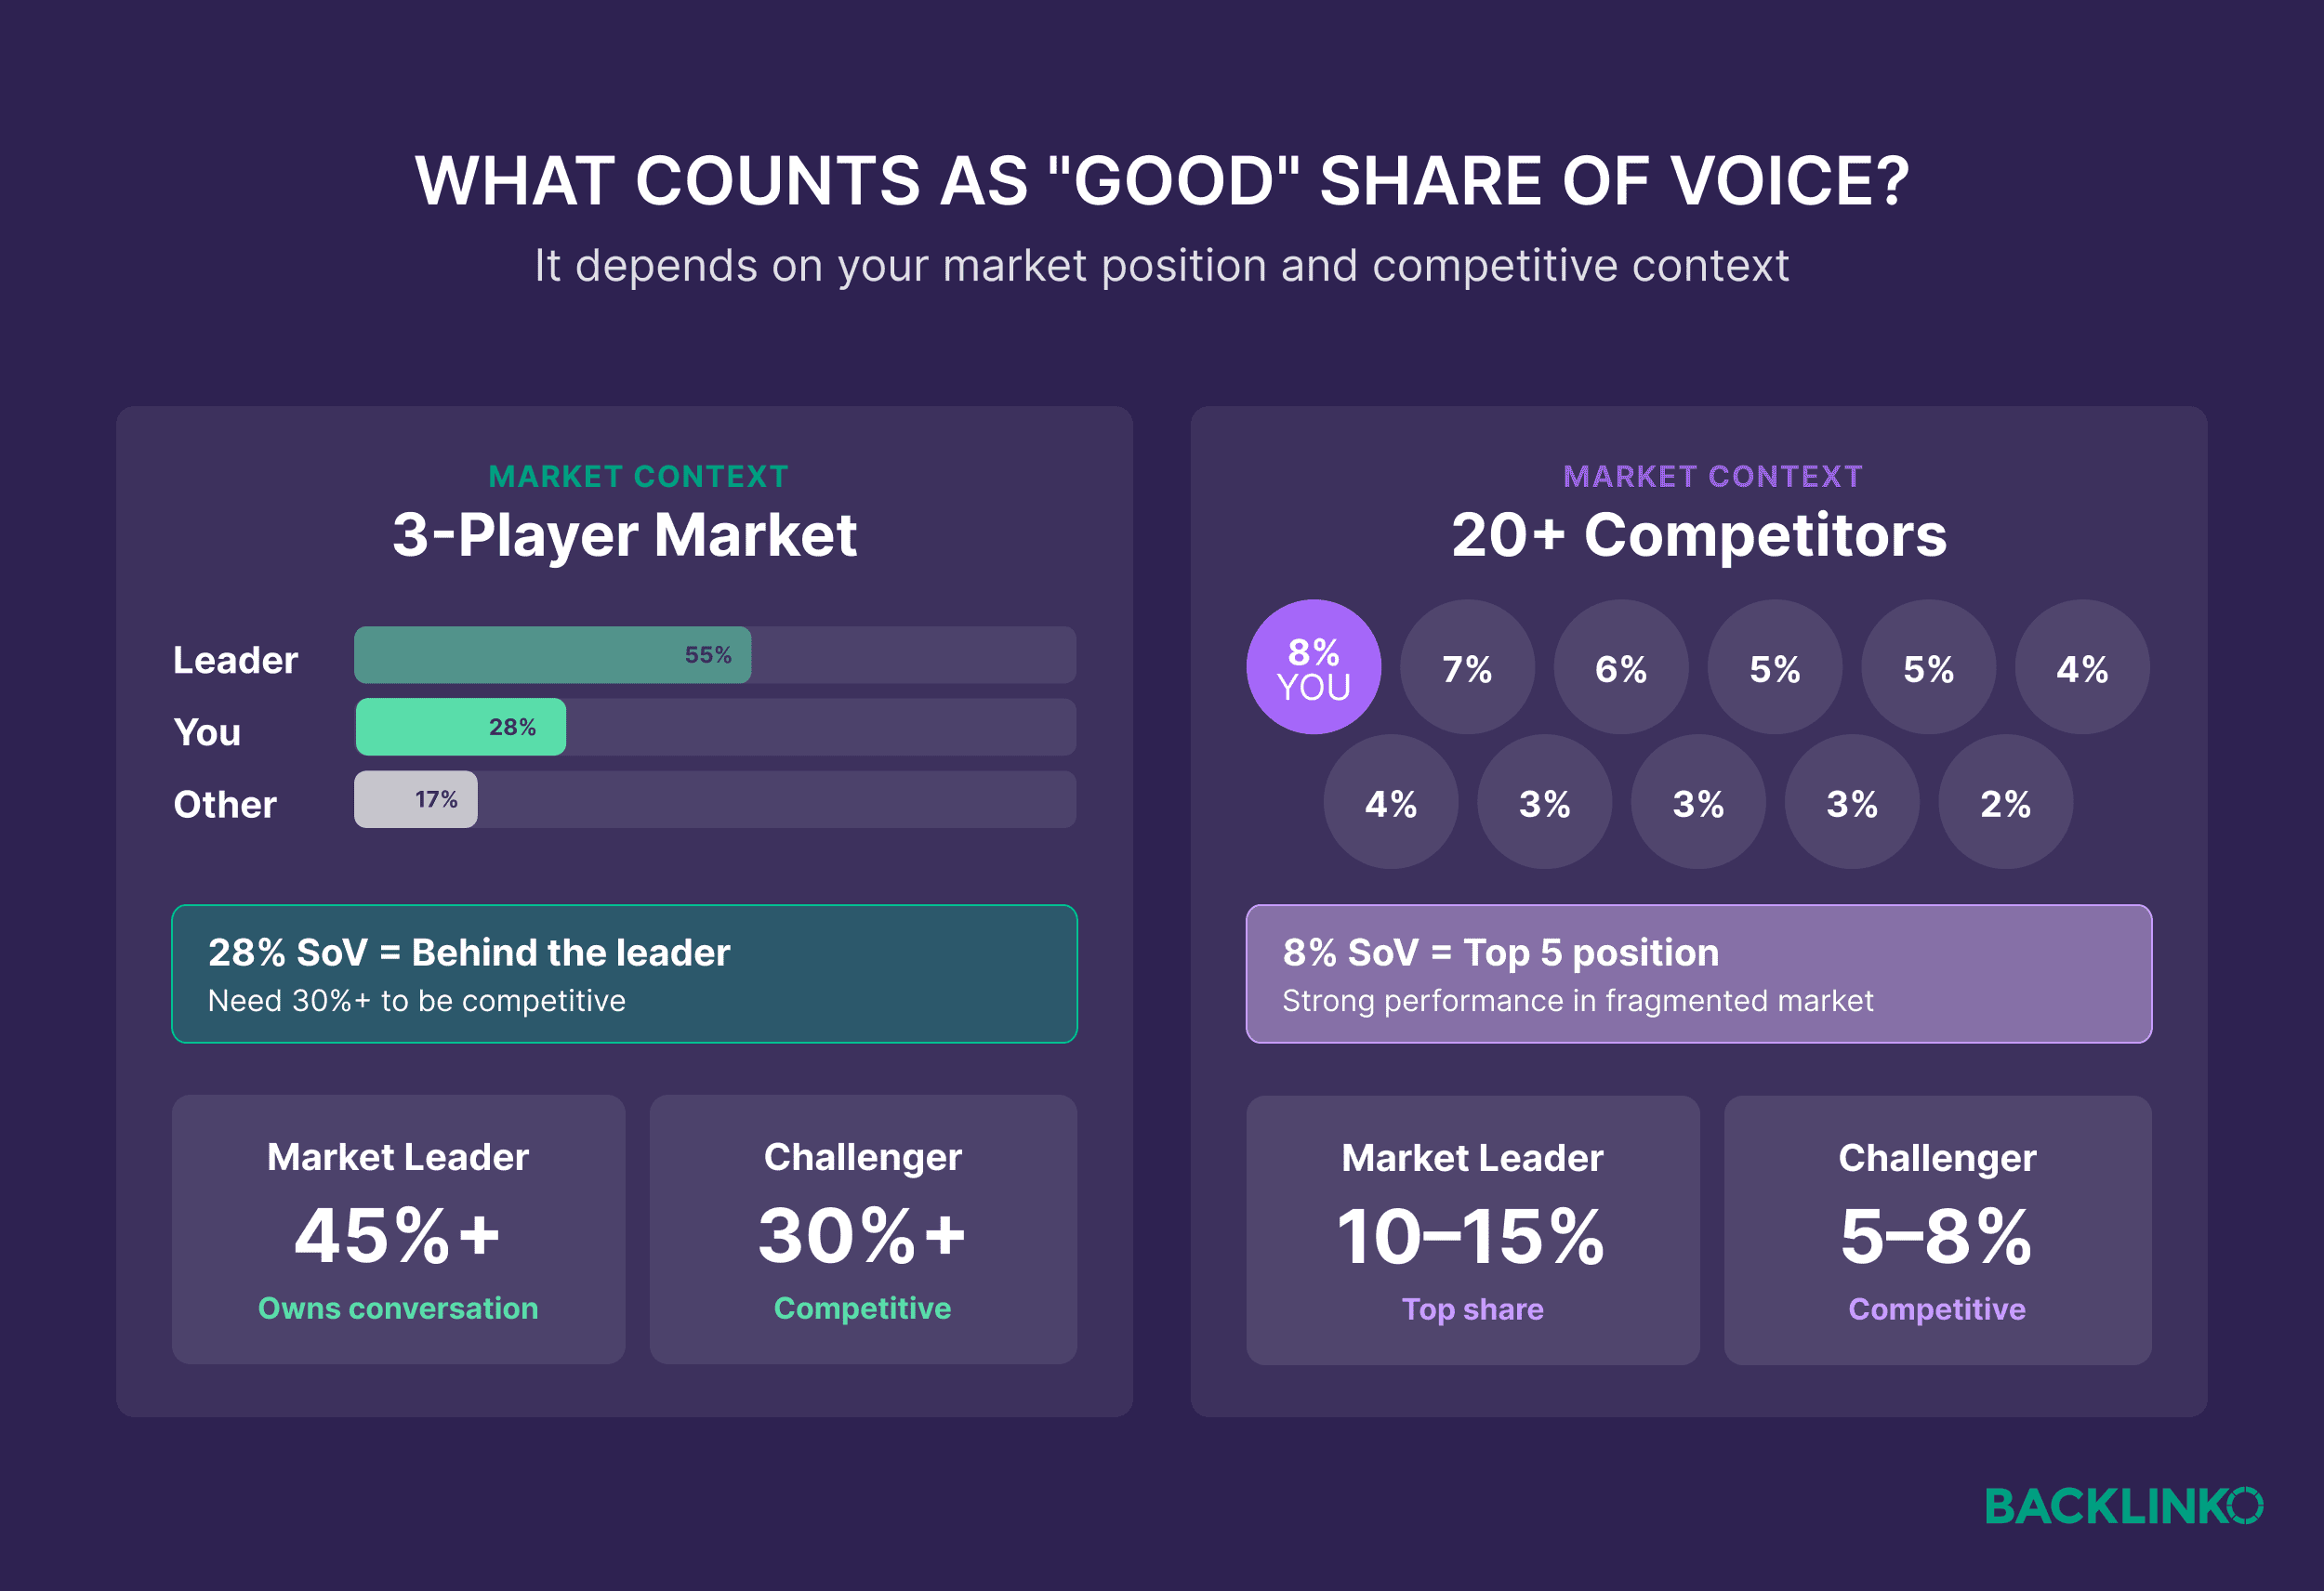
Establishing a universal benchmark for a "good" Share of Voice is challenging, as the ideal percentage is highly contextual. It is fundamentally influenced by a brand’s specific competitive landscape, the maturity of its industry, and prevailing market dynamics. For instance, a nascent brand entering a saturated market might consider 10-15% SoV a significant achievement, whereas an established market leader might aim to maintain a 40%+ SoV to defend its position. Moreover, a high SoV in a contracting or declining market segment can be a deceptive vanity metric. The true measure of success lies in a brand’s ability to grow its SoV in alignment with, or ideally exceeding, the overall growth of its category. Industry analysts frequently advise brands to not only track their raw SoV but also its trajectory in relation to market expansion.
The Dual Landscape: SEO SoV vs. AI SoV
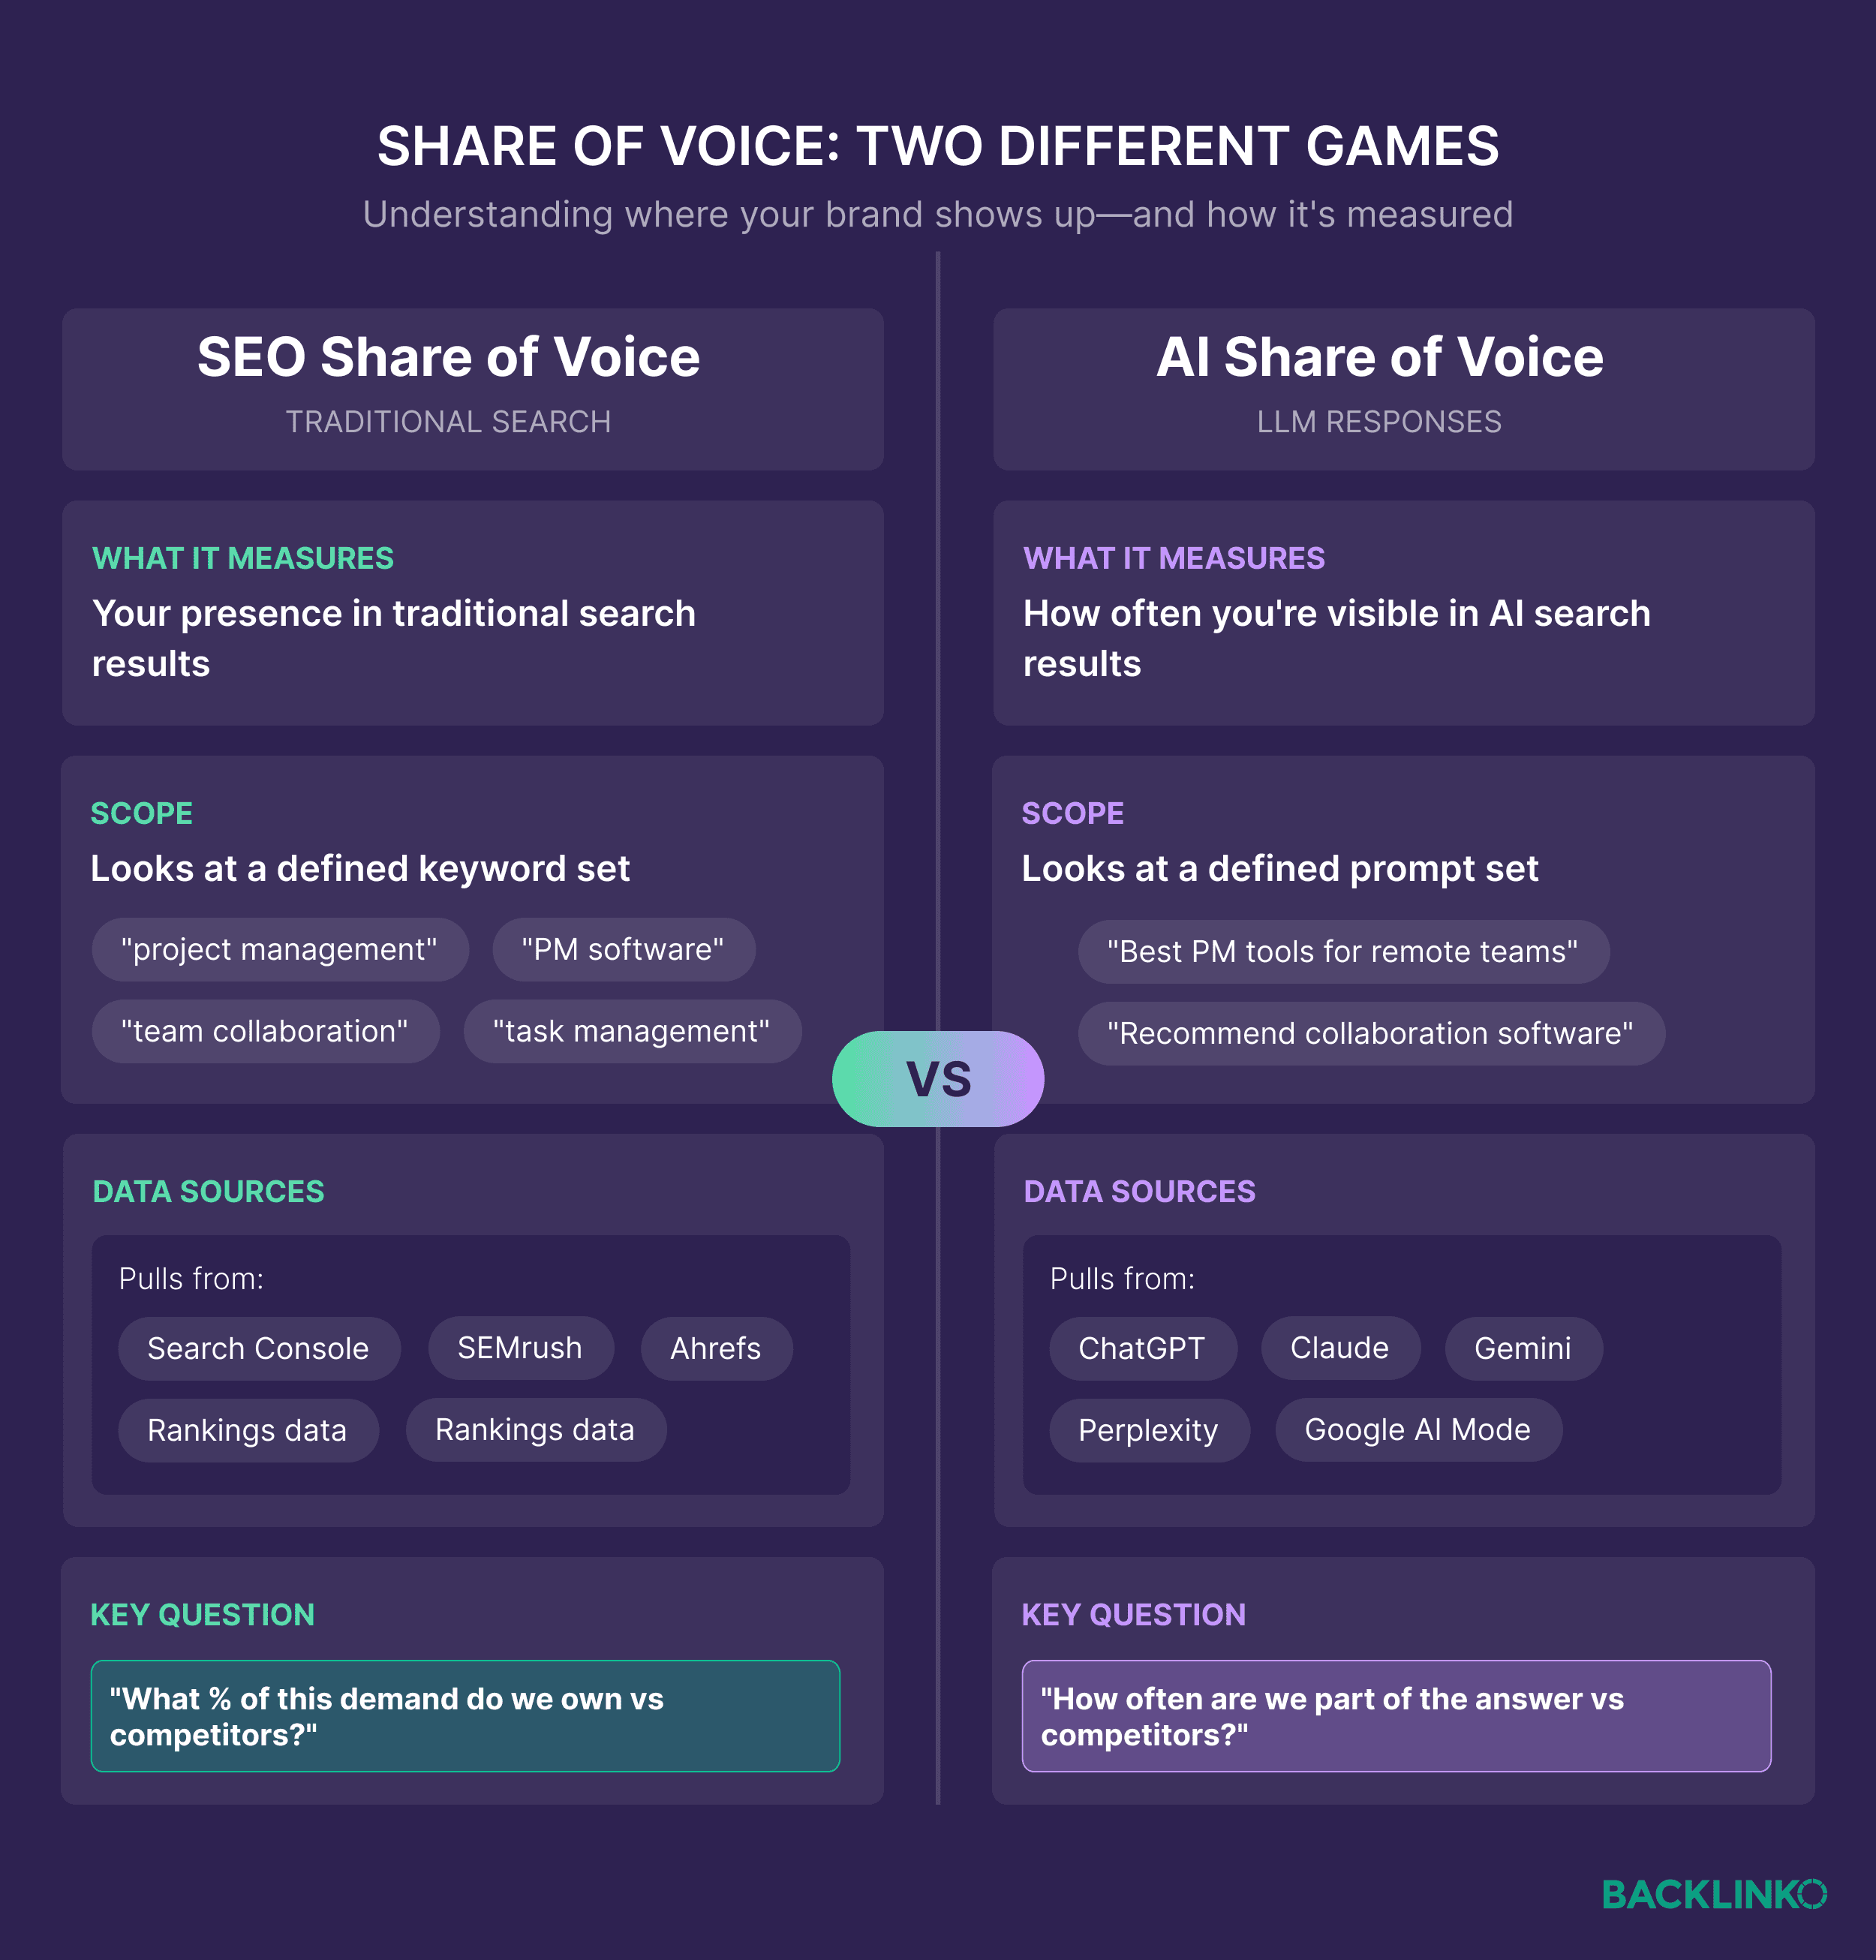
Both SEO SoV and AI SoV address the fundamental question of a brand’s ownership of category demand, yet they operate within distinct search contexts.
SEO SoV specifically quantifies a brand’s proportion of traditional organic search traffic. For example, if a brand tracks 100 relevant keywords that collectively generate 50,000 monthly visits across all ranking websites, and its own content captures 15,000 of those visits, its organic SoV would be 30%. This metric is a direct indicator of a brand’s performance in conventional search engine results pages (SERPs).
AI SoV, on the other hand, measures how frequently a brand is mentioned or cited in the responses generated by Large Language Models (LLMs) such as ChatGPT, Perplexity, and Google AI Mode. For instance, if a brand tests 100 category-specific prompts and its brand is mentioned in 45 responses, with 15 direct citations, while a competitor is mentioned in 30 responses with 10 citations, an AI visibility tool can calculate a weighted AI SoV. This weighted approach often gives more credit to direct citations, recognizing their higher impact on credibility and user trust. The emergence of AI in search has fundamentally altered how brands need to think about visibility, shifting from mere ranking to being part of the authoritative narrative presented by AI.
The Growing Imperative of Share of Voice in a Fragmented Digital World
The heightened importance of Share of Voice, particularly in the current digital climate, stems from several critical factors that render traditional traffic metrics increasingly insufficient.
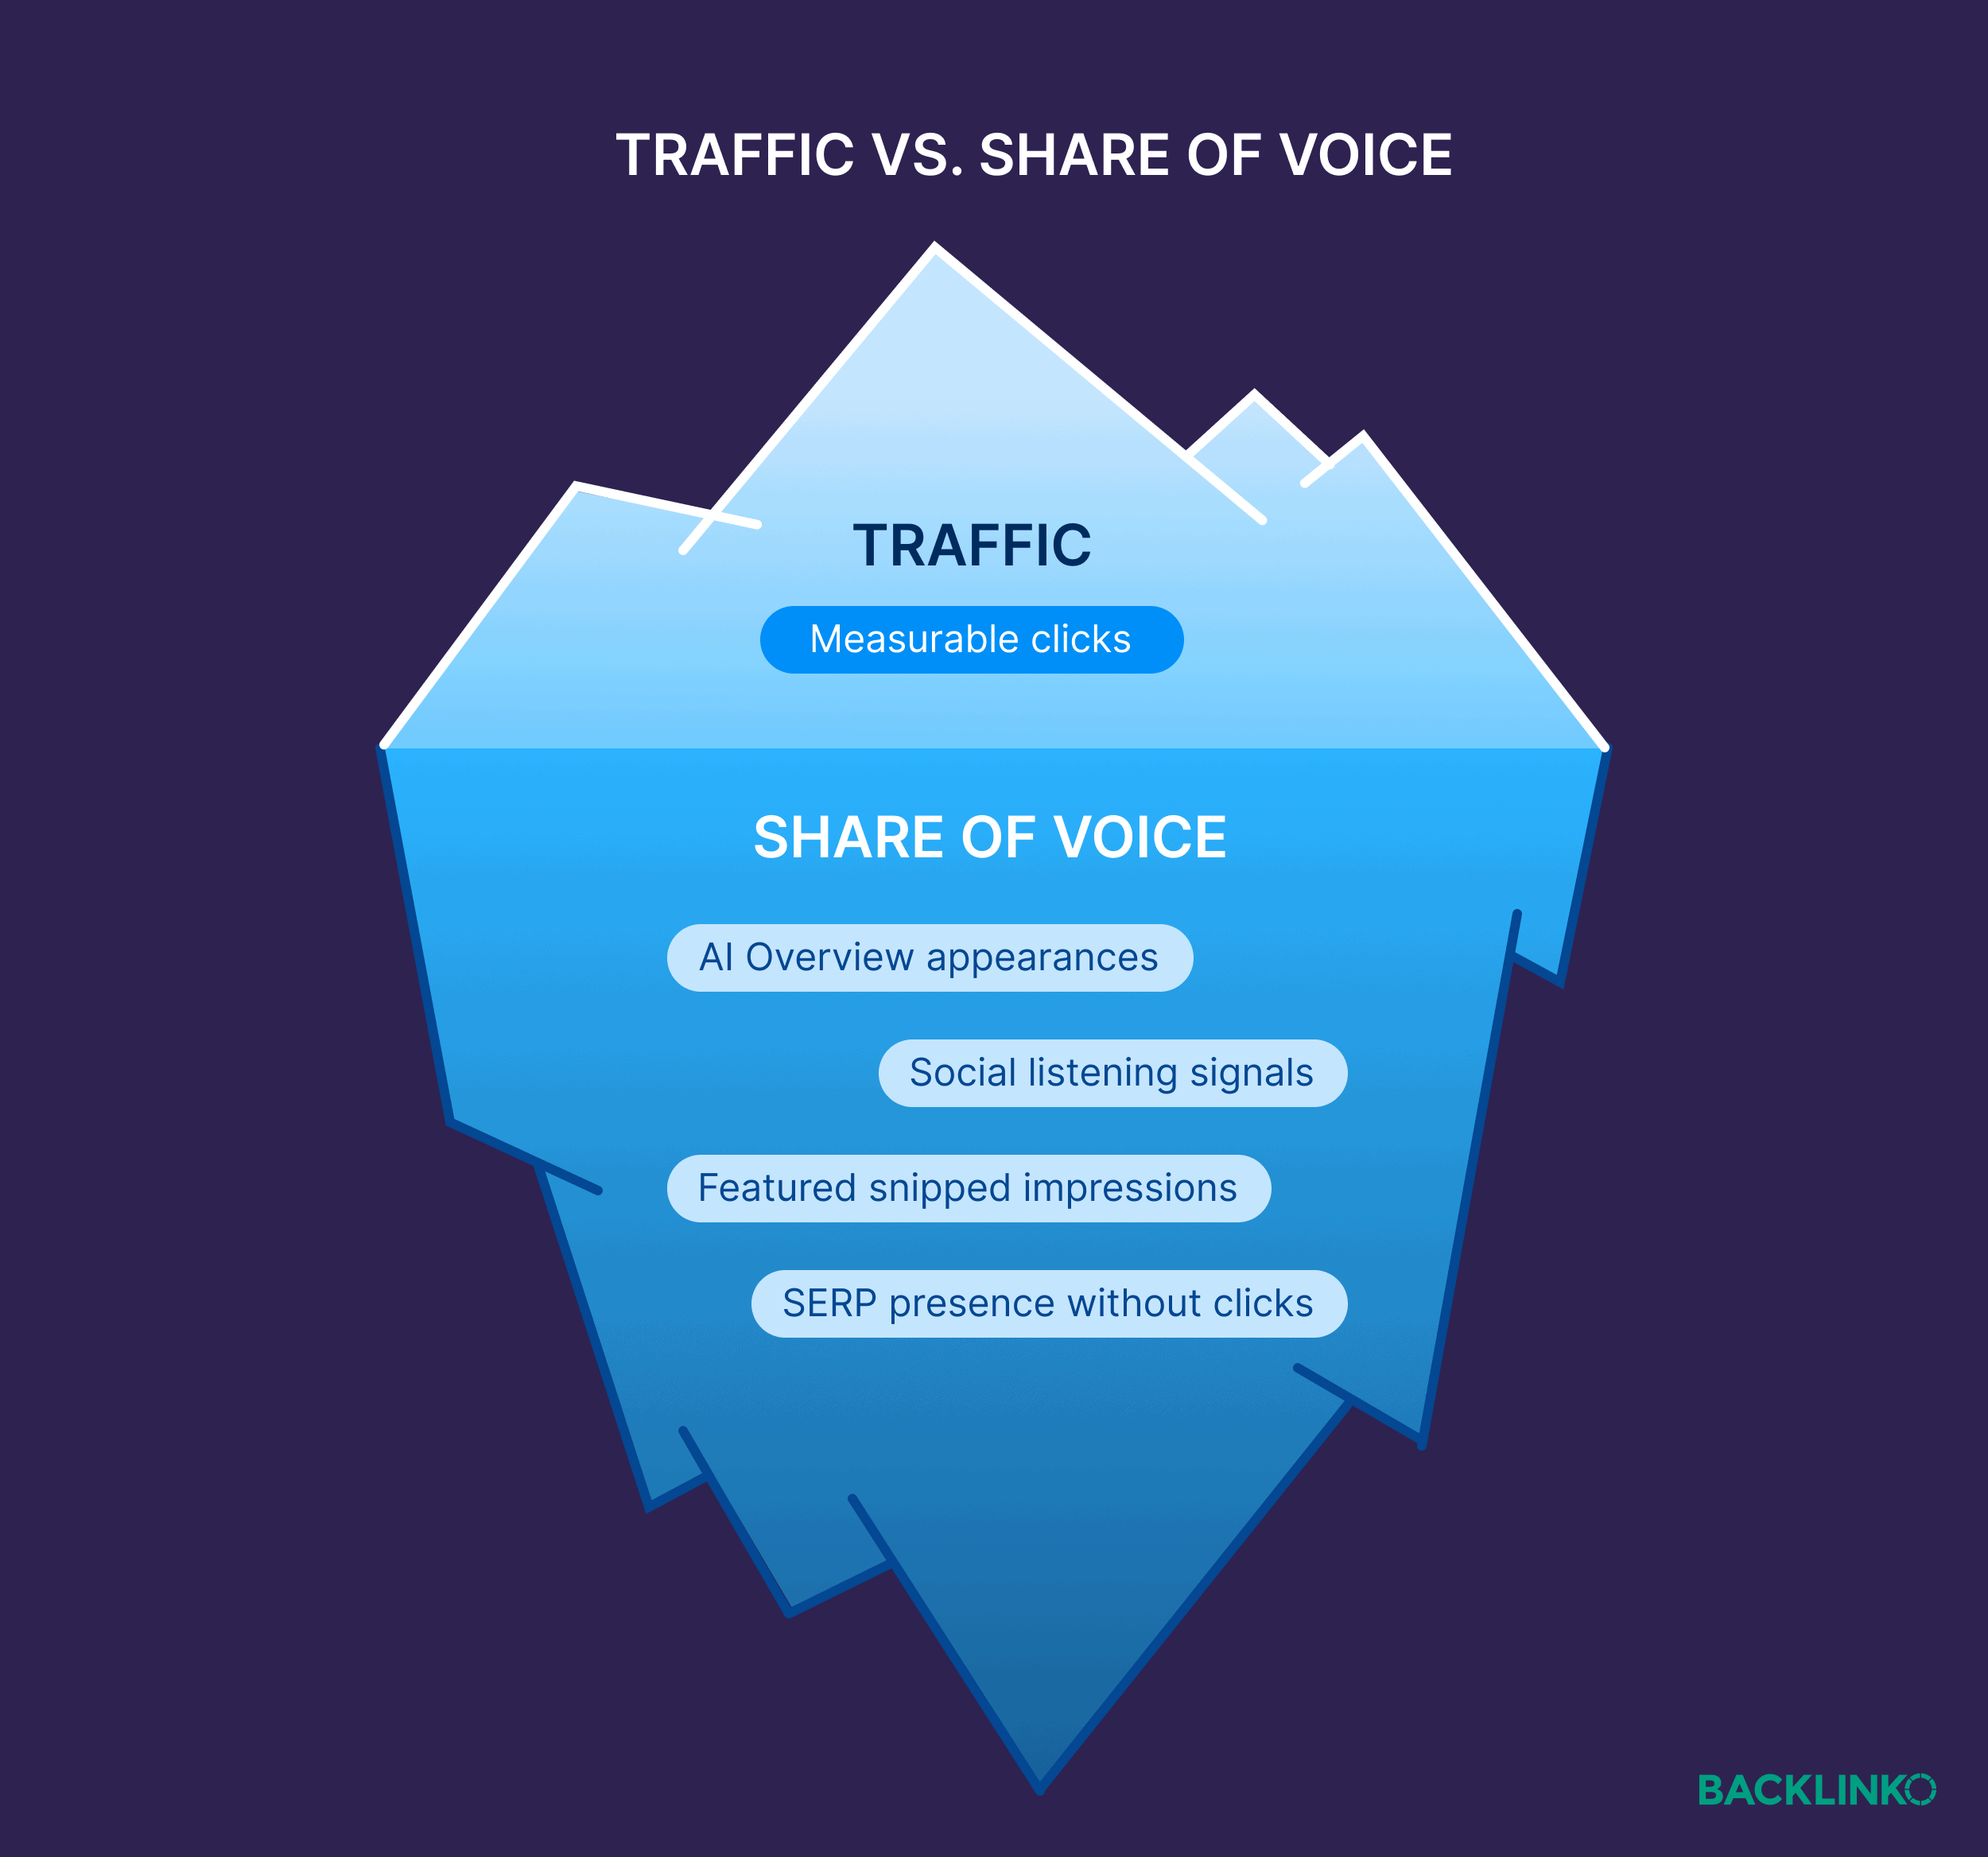
Tracking Visibility Beyond Traditional Traffic Data: Organic traffic data, once the gold standard, now presents an incomplete narrative. With the proliferation of "zero-click" searches – where users find answers directly within AI Overviews, featured snippets, and other enriched search results without ever clicking through to a website – a substantial portion of a brand’s initial exposure remains unrecorded by tools like Google Analytics. This renders traditional traffic a lagging indicator of actual visibility. SoV, by contrast, offers a superior metric because it quantifies a brand’s presence within the critical "consideration set," even when direct website clicks don’t immediately occur.
Consider a user searching for "best project management software for remote teams." An AI Overview might list five top tools, including a specific brand. The user consumes this information, doesn’t click any links, but later, remembering the brand, navigates directly to its website to sign up for a demo. Traditional analytics would categorize this as "direct traffic," completely missing the crucial initial discovery phase facilitated by the AI. SoV, however, would accurately reflect the brand’s appearance within that high-intent query’s consideration set, providing invaluable insight into its top-of-funnel influence.
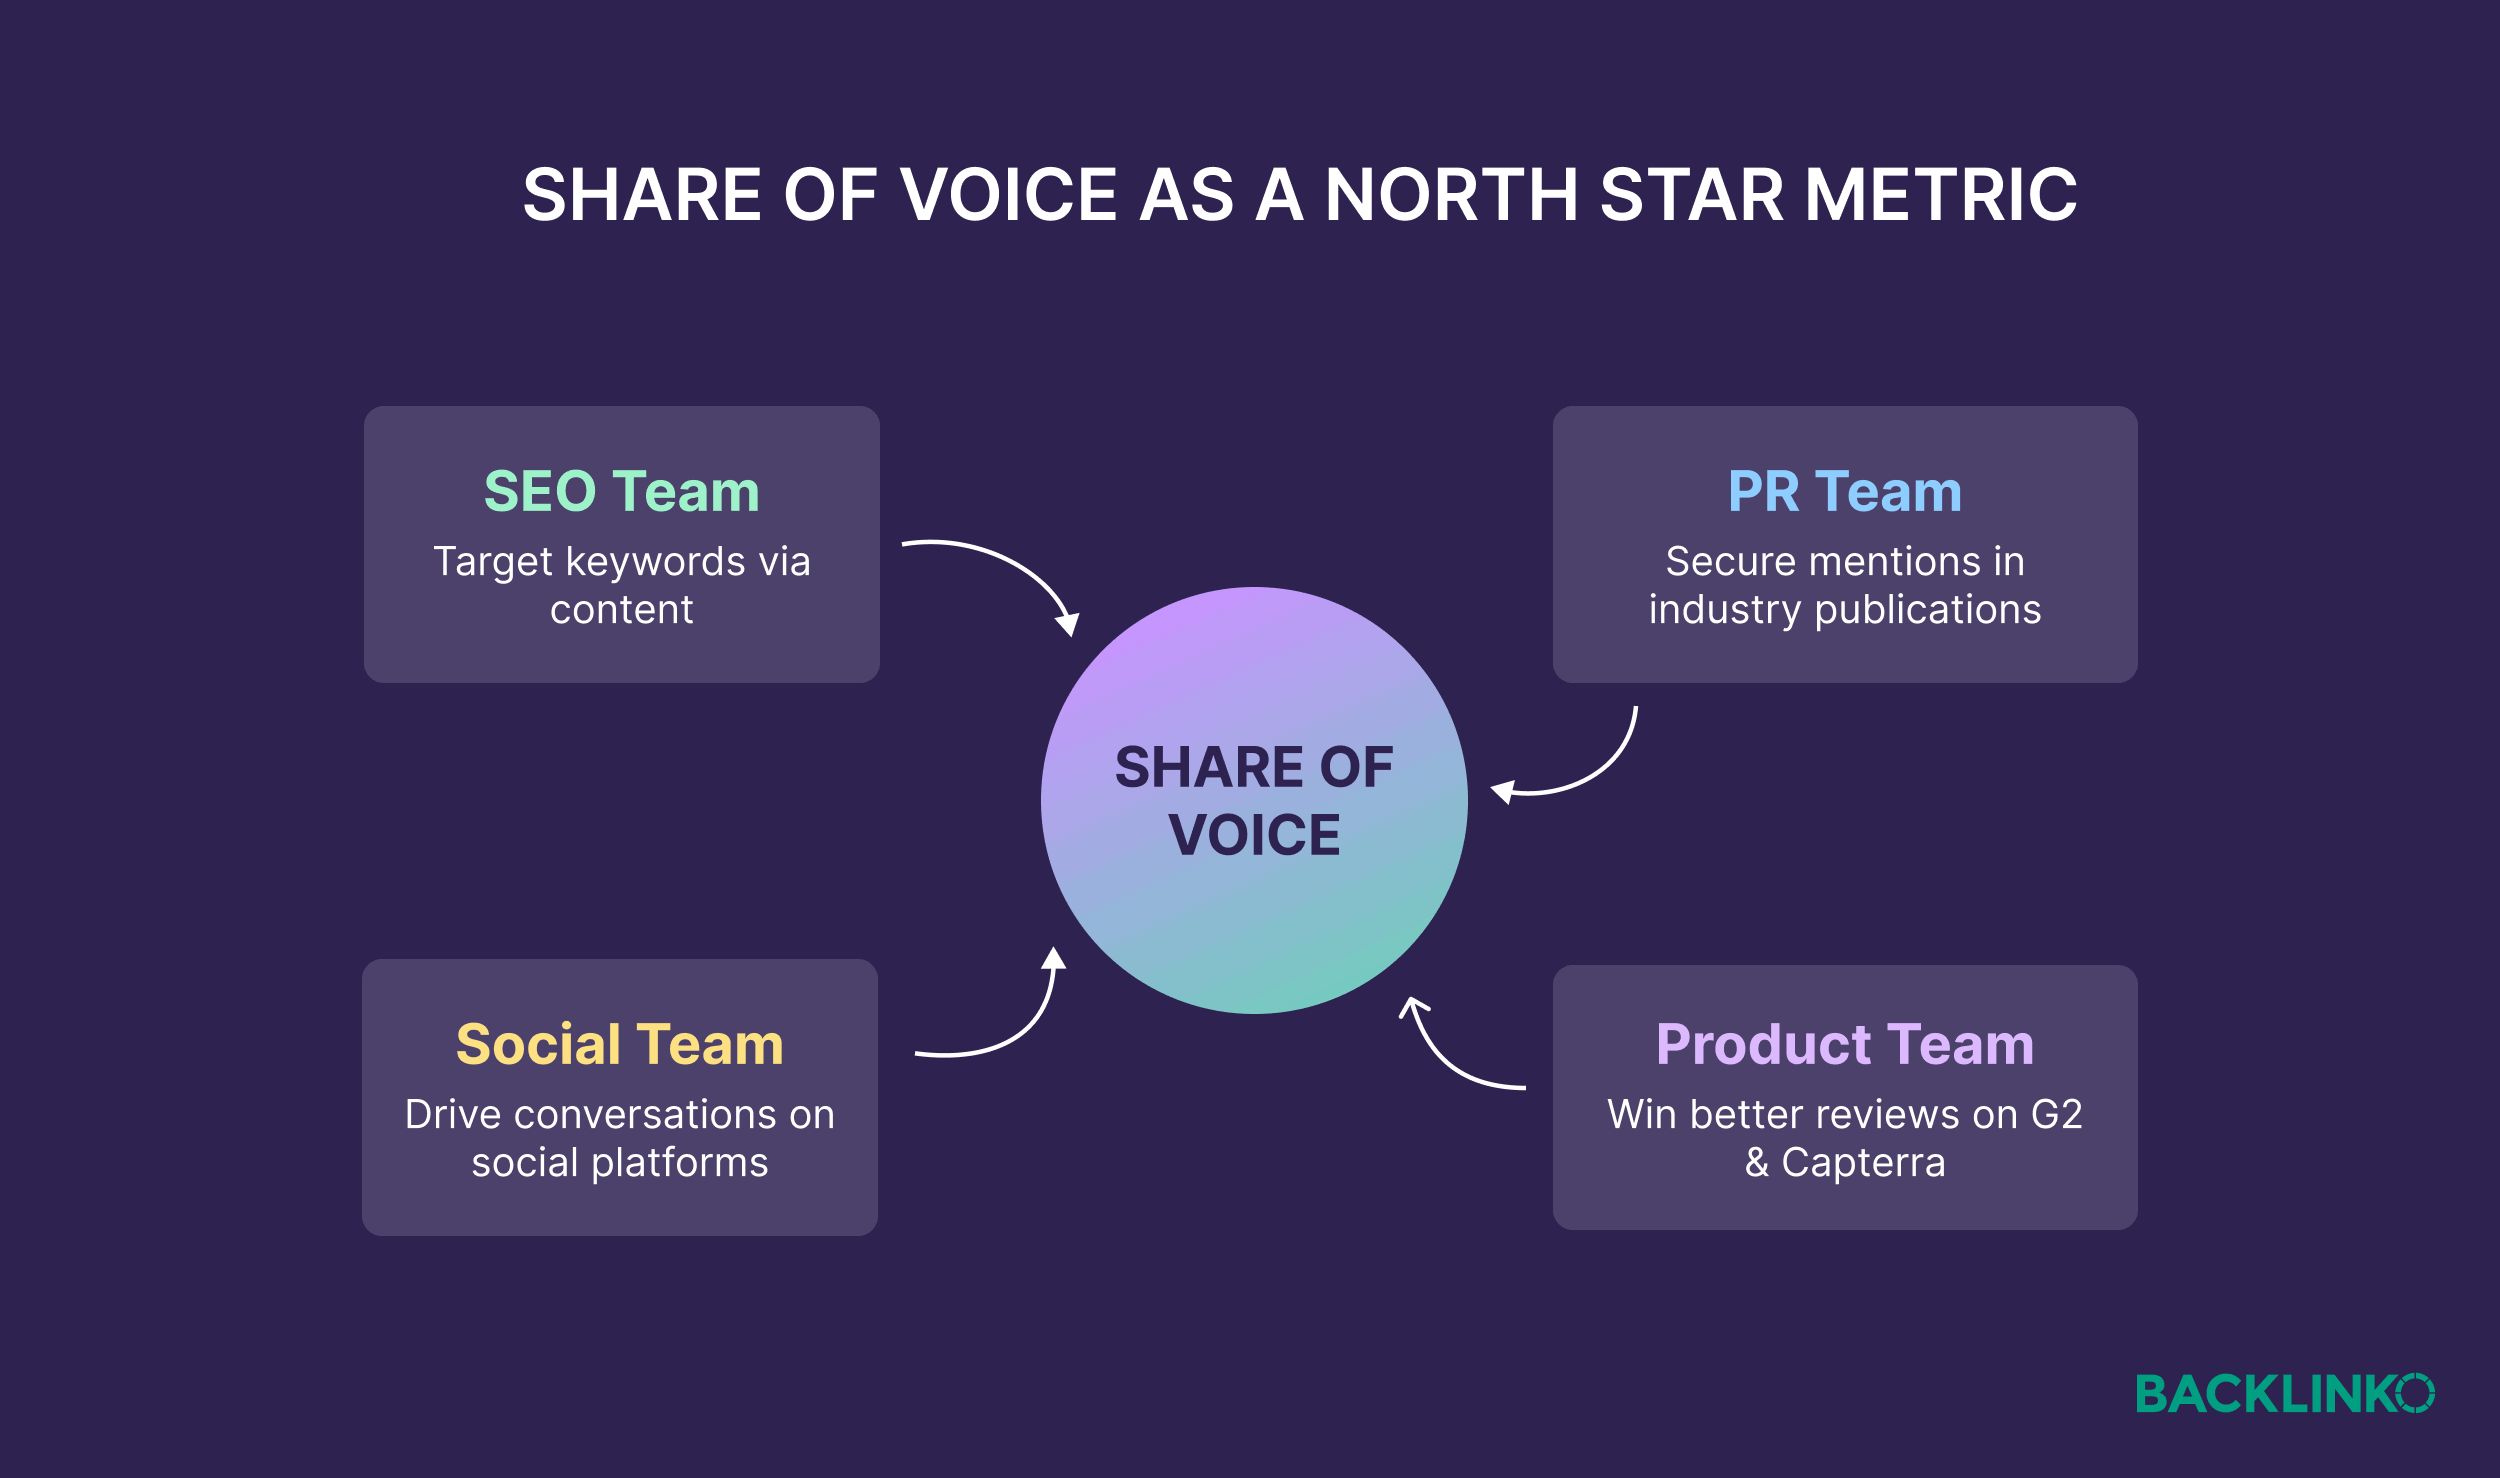
A Unified North Star Metric for Marketing Teams: A common challenge in large organizations is marketing team silos, where SEO, PR, social media, and paid media departments often pursue disparate Key Performance Indicators (KPIs). The SEO team might optimize for website visits, PR for media mentions, and social media for engagement, leading to fragmented efforts and potential resource inefficiencies. SoV offers a powerful solution by serving as a unifying "North Star Metric." When all teams understand how their individual contributions feed into a collective brand visibility percentage, it fosters unparalleled collaboration and strategic alignment.

For example, an SEO team’s efforts in optimizing content for AI snippets, a PR team’s successful media placements, and a social media team’s viral campaign all contribute directly to a measurable increase in overall brand SoV. This shared objective transforms departmental efforts into a cohesive strategy, enabling leadership to allocate resources more effectively towards initiatives that demonstrably enhance market presence and influence. This holistic perspective, while initially requiring a foundational measurement in search, eventually allows for layering in other channels to create a truly comprehensive view of brand influence.
Measuring Share of Voice: A Four-Step Strategic Approach
Implementing an effective SoV measurement system requires a structured, multi-step approach. Using a fictional project management software company as an illustrative case, these steps demonstrate how to translate data into actionable business insights.
Step 1: Defining the Industry Landscape
The foundational step involves meticulously outlining the specific competitive environment and the universe of keywords and topics relevant to a brand’s target audience. Without clearly defined boundaries, measurement efforts risk either overlooking critical gaps or becoming overwhelmed by irrelevant noise. This process begins by identifying "topic clusters" that directly correlate with revenue generation. For a project management software, these clusters might include "Agile project management," "Team collaboration tools," and "Project tracking and reporting."
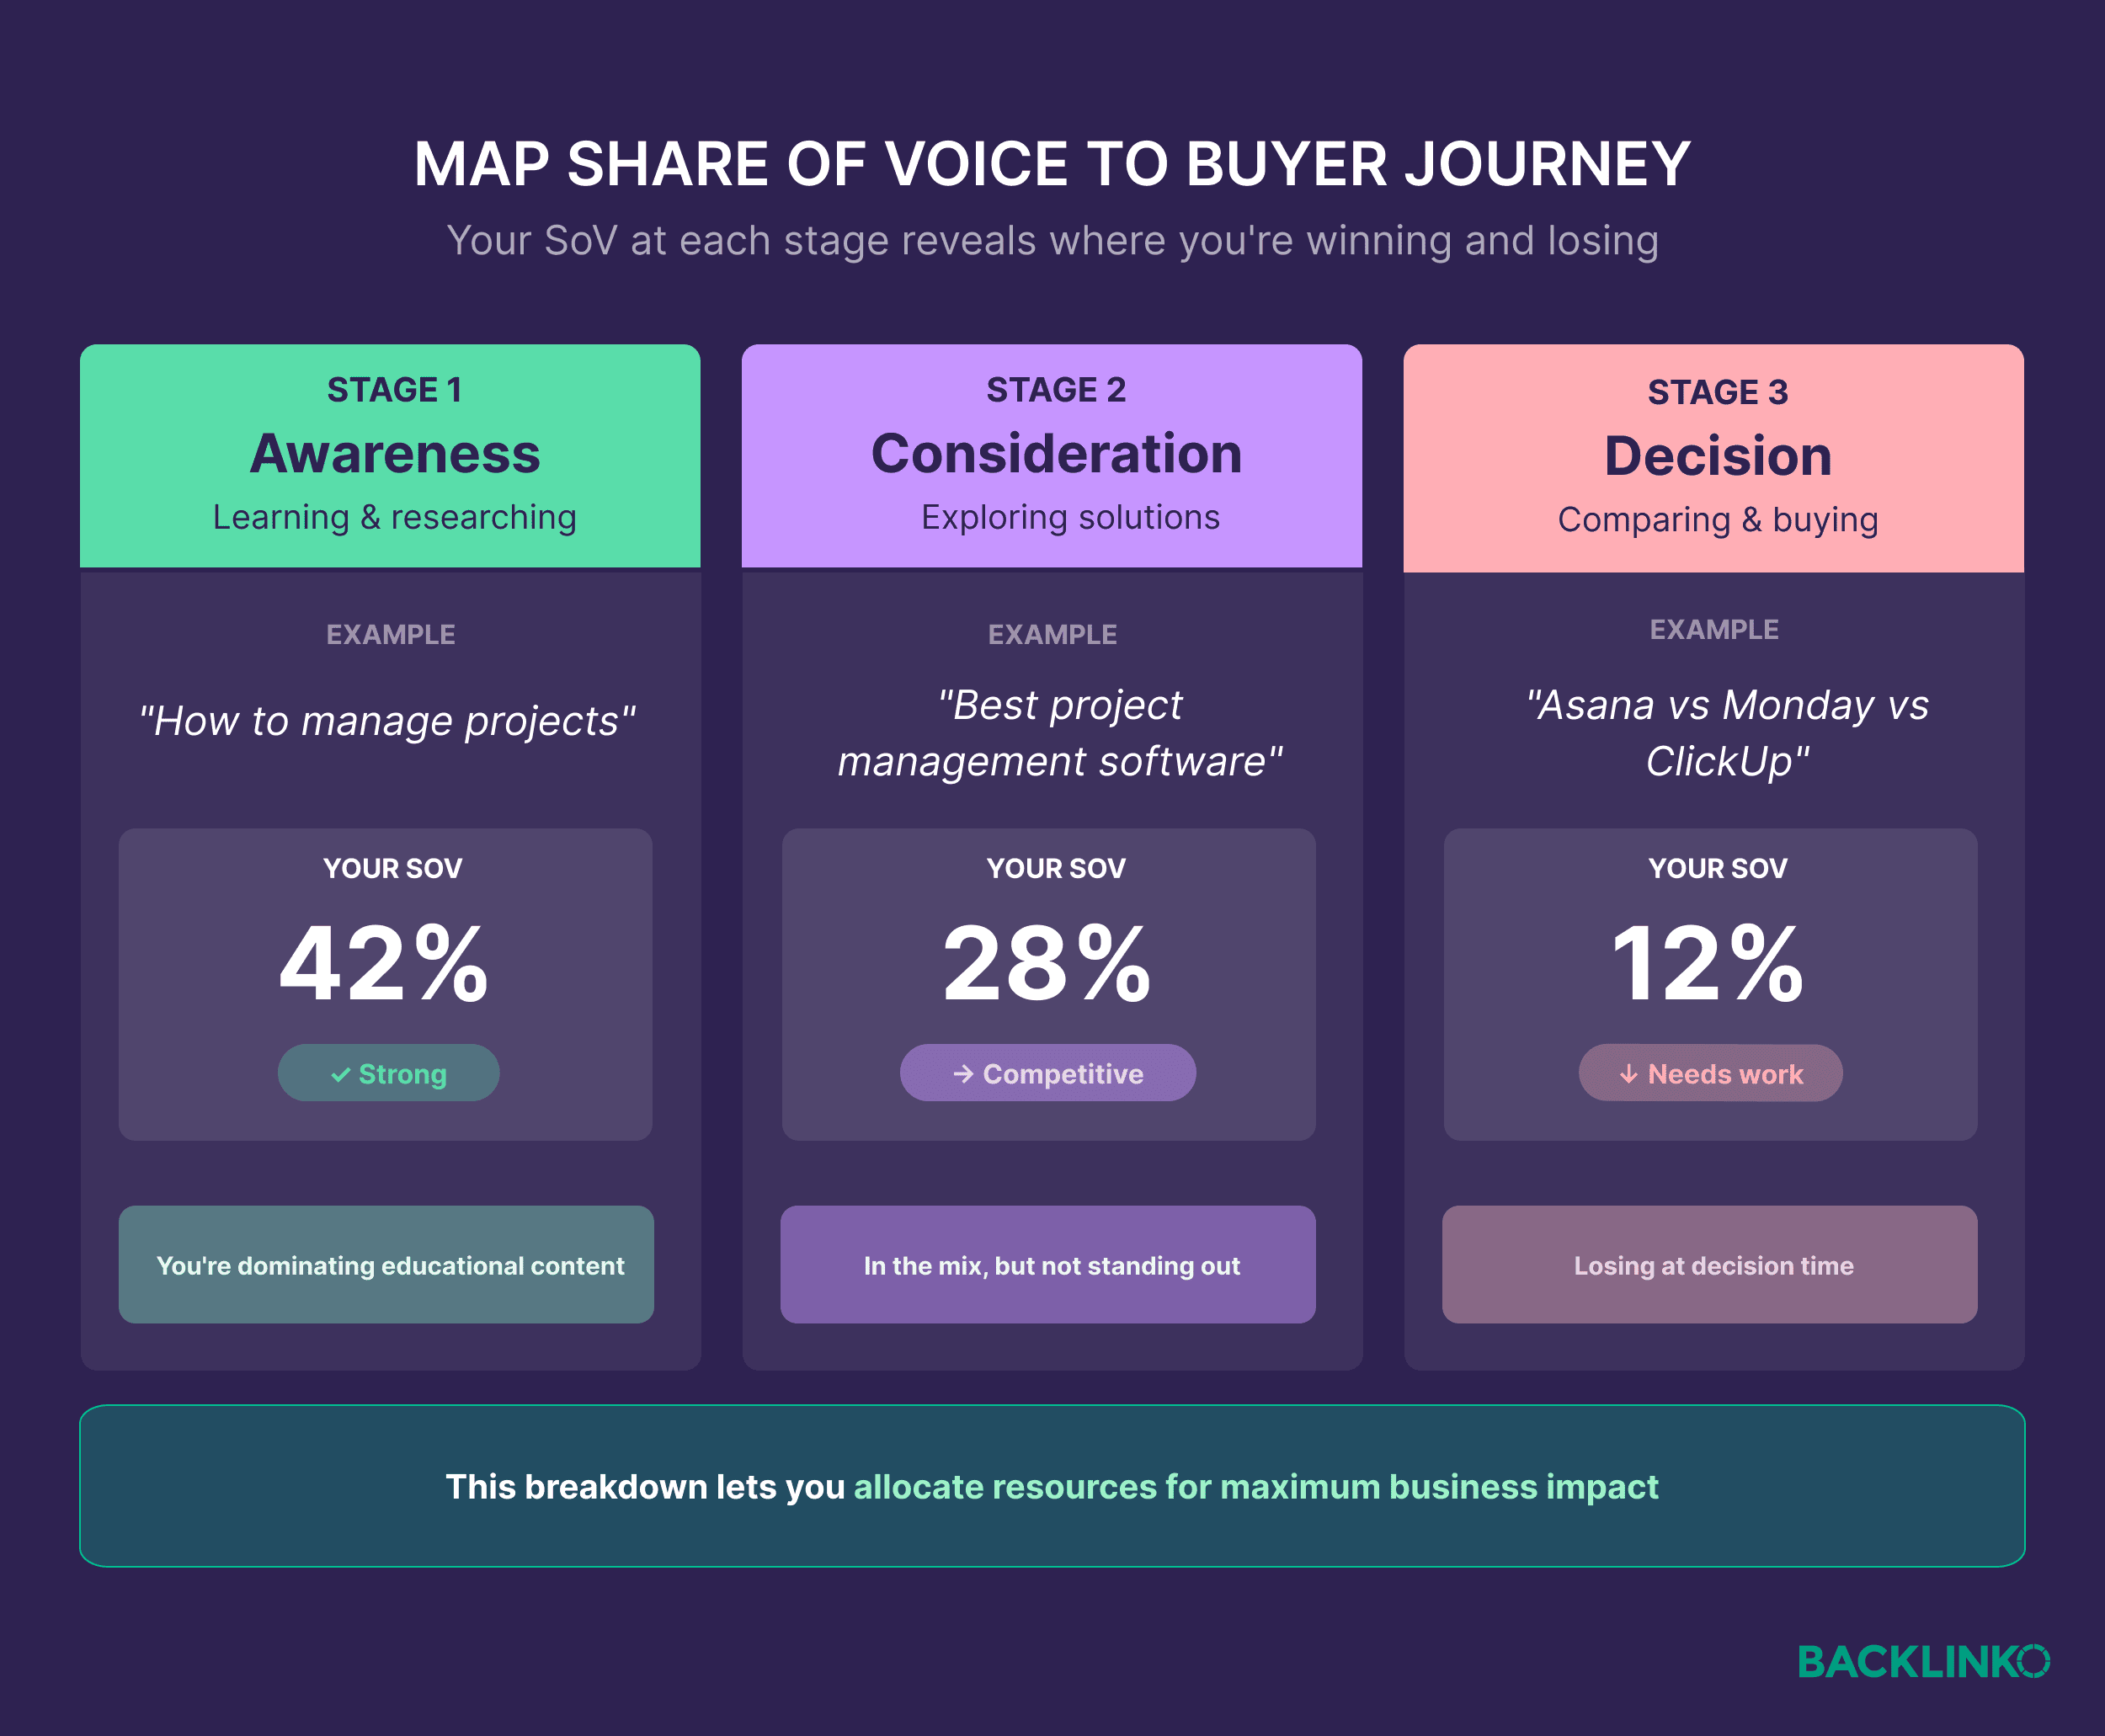
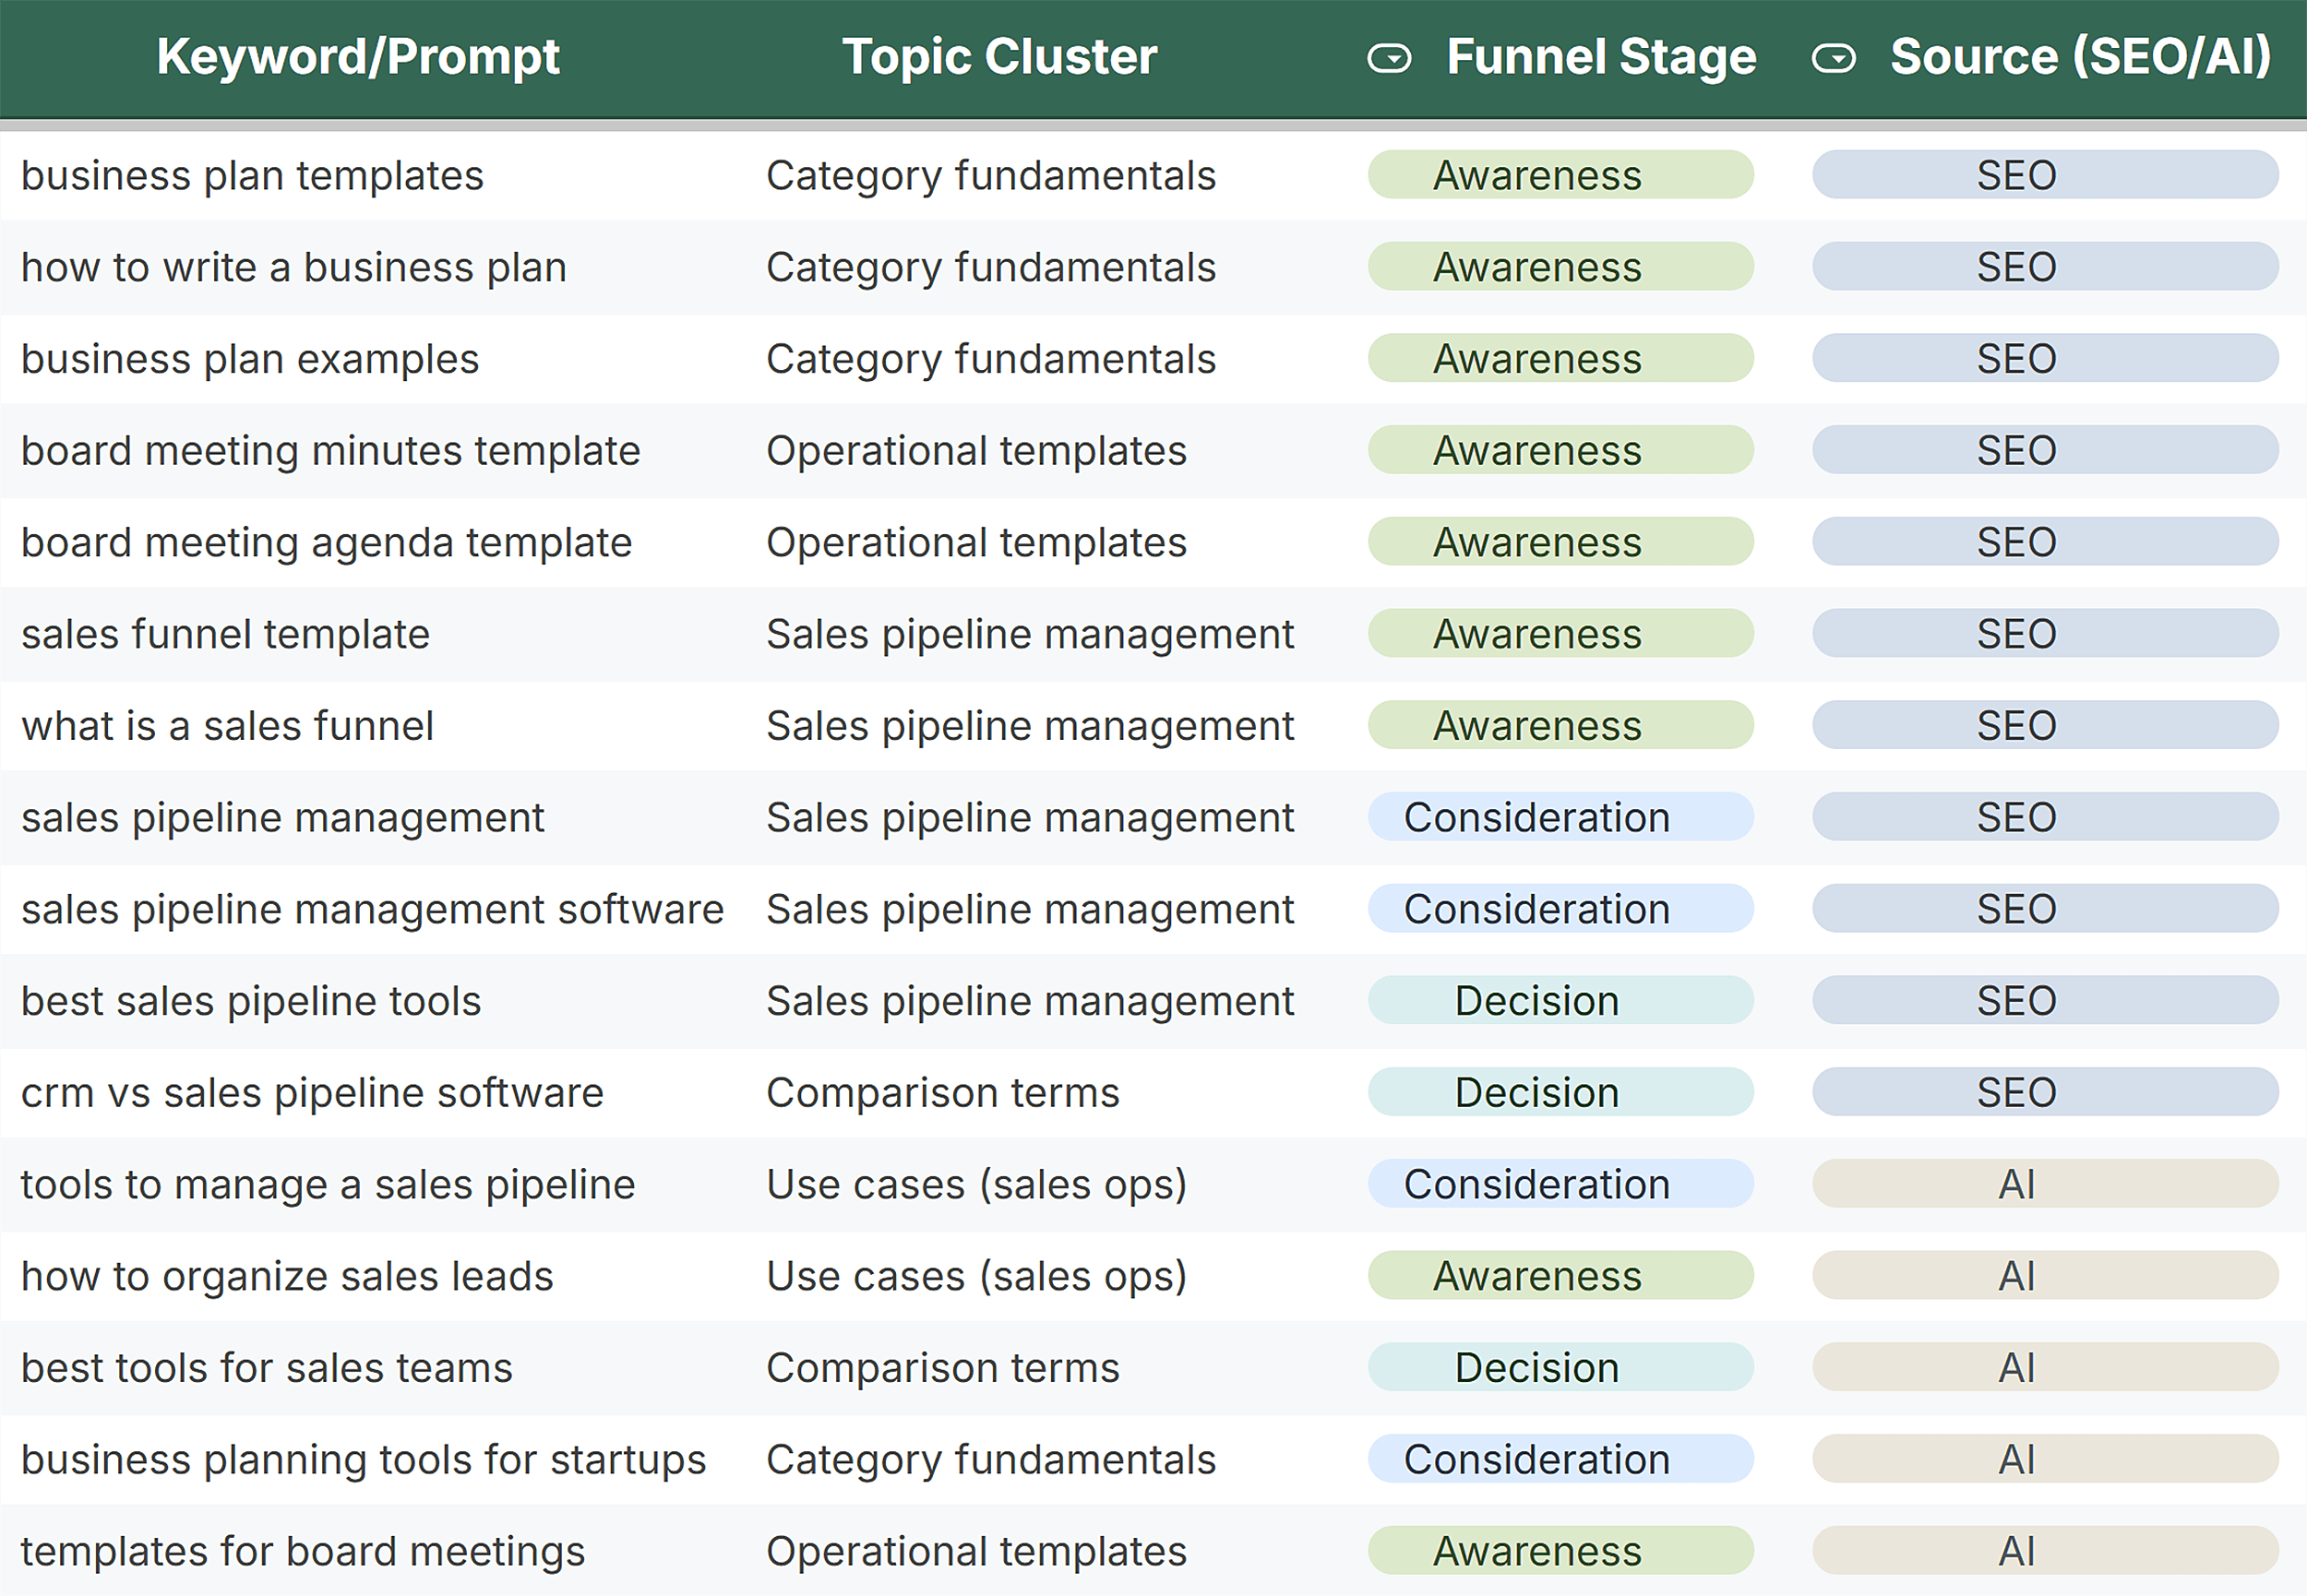
To enhance strategic depth, these topic clusters should be mapped to the stages of the buyer journey:
- Awareness: Broad, informational queries (e.g., "what is agile project management").
- Consideration: Solution-oriented searches (e.g., "best project management software for agencies").
- Decision: Specific comparison or purchase-intent queries (e.g., "[Brand A] vs. [Brand B]").
Analyzing SoV at each stage provides critical insights into where a brand is winning or losing influence, thereby guiding resource allocation for maximum business impact. For instance, if the project management software reveals high SoV at the awareness stage but almost none at the decision stage, it signifies a problem: the brand is educating the market but is invisible when prospects are actively comparing solutions. The strategic takeaway would be to prioritize content creation around comparison pages and detailed case studies to boost decision-stage visibility.
Beyond topics, it is crucial to define who the brand is competing against. This includes direct product/service competitors and "category authorities" – independent review sites, industry blogs, or expert forums that heavily influence buyer decisions. Tracking both provides a complete picture of market influence and identifies opportunities for competitive differentiation.
Step 2: Building Comprehensive Keyword and Prompt Libraries
The next critical step involves compiling a robust library of 200-500 queries that accurately reflect how target audiences search within the category. This library must encompass both traditional keywords (for organic search) and conversational prompts (for AI search) to capture the full spectrum of search visibility.
Sourcing SEO Data: The process begins with extracting keywords where the brand already exhibits visibility. Google Search Console (GSC) is an invaluable starting point, as its "Performance" report’s "Queries" tab, sorted by "Impressions," reveals every instance a brand’s content appeared in search results, regardless of clicks. Similarly, exporting high-performing keywords from Google Ads campaigns (those with conversions or high CTR) adds further depth. Tools like Semrush’s Position Tracking can also be leveraged to identify top-performing keywords for the brand and its competitors.

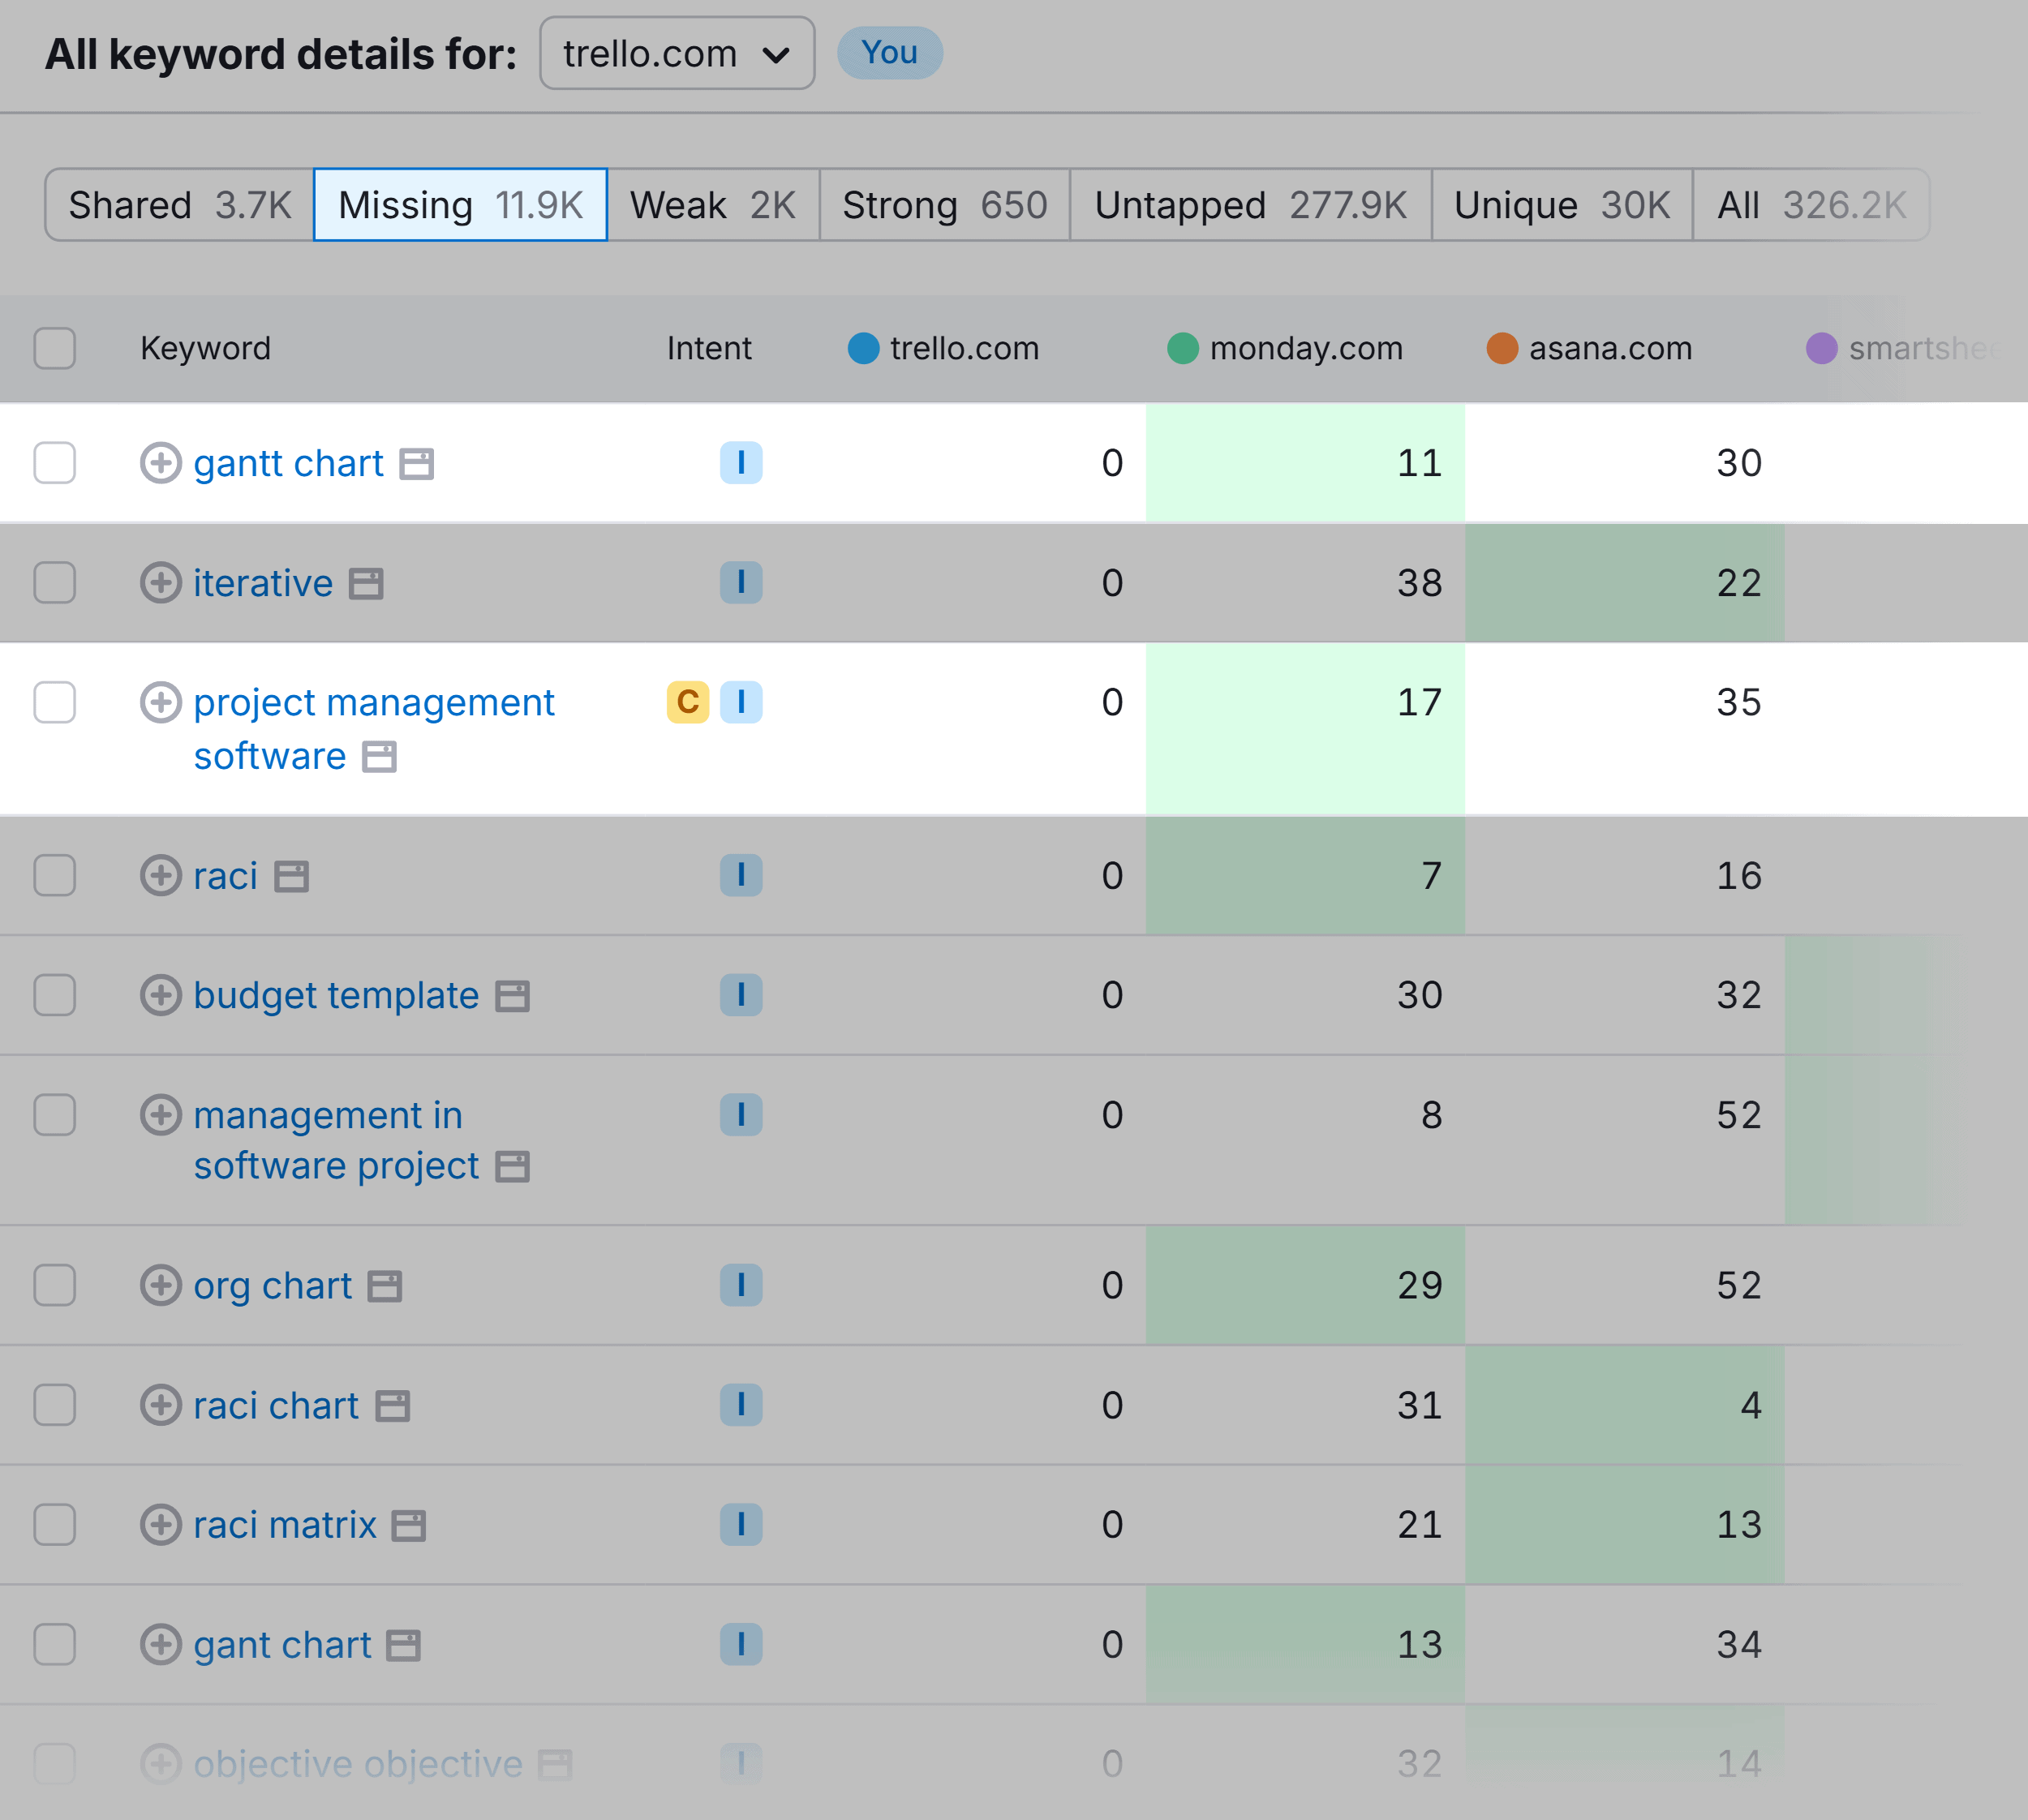
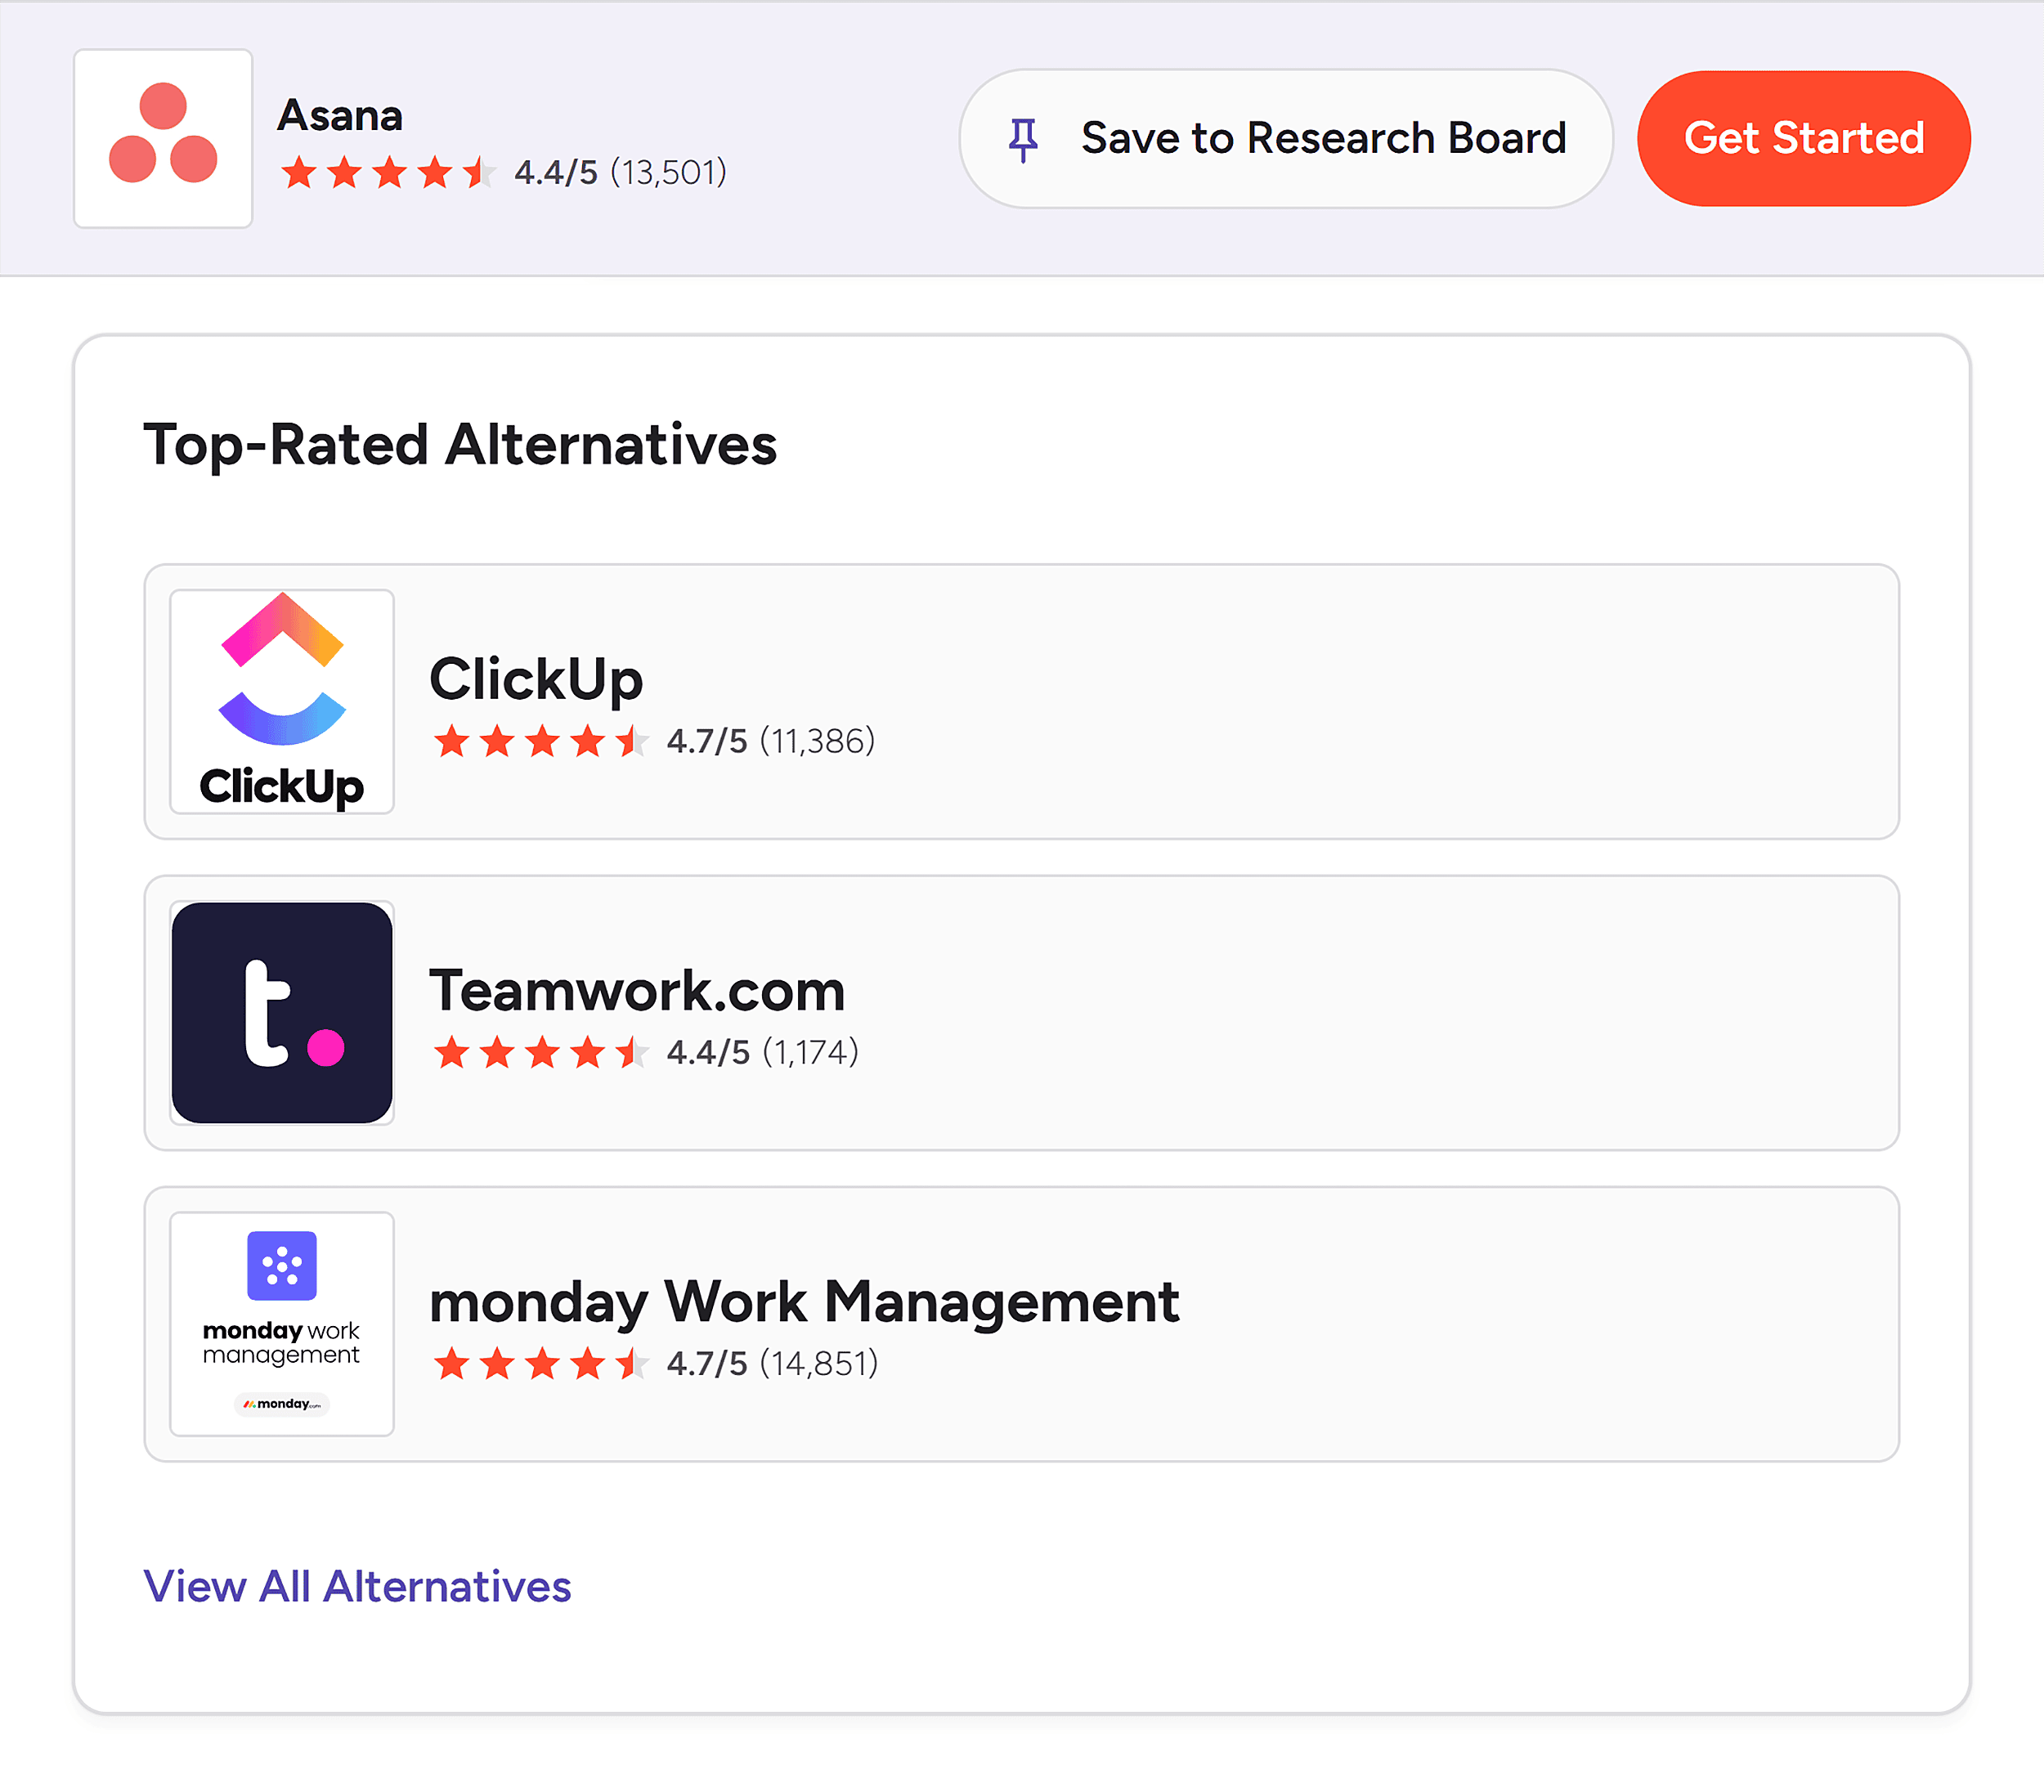
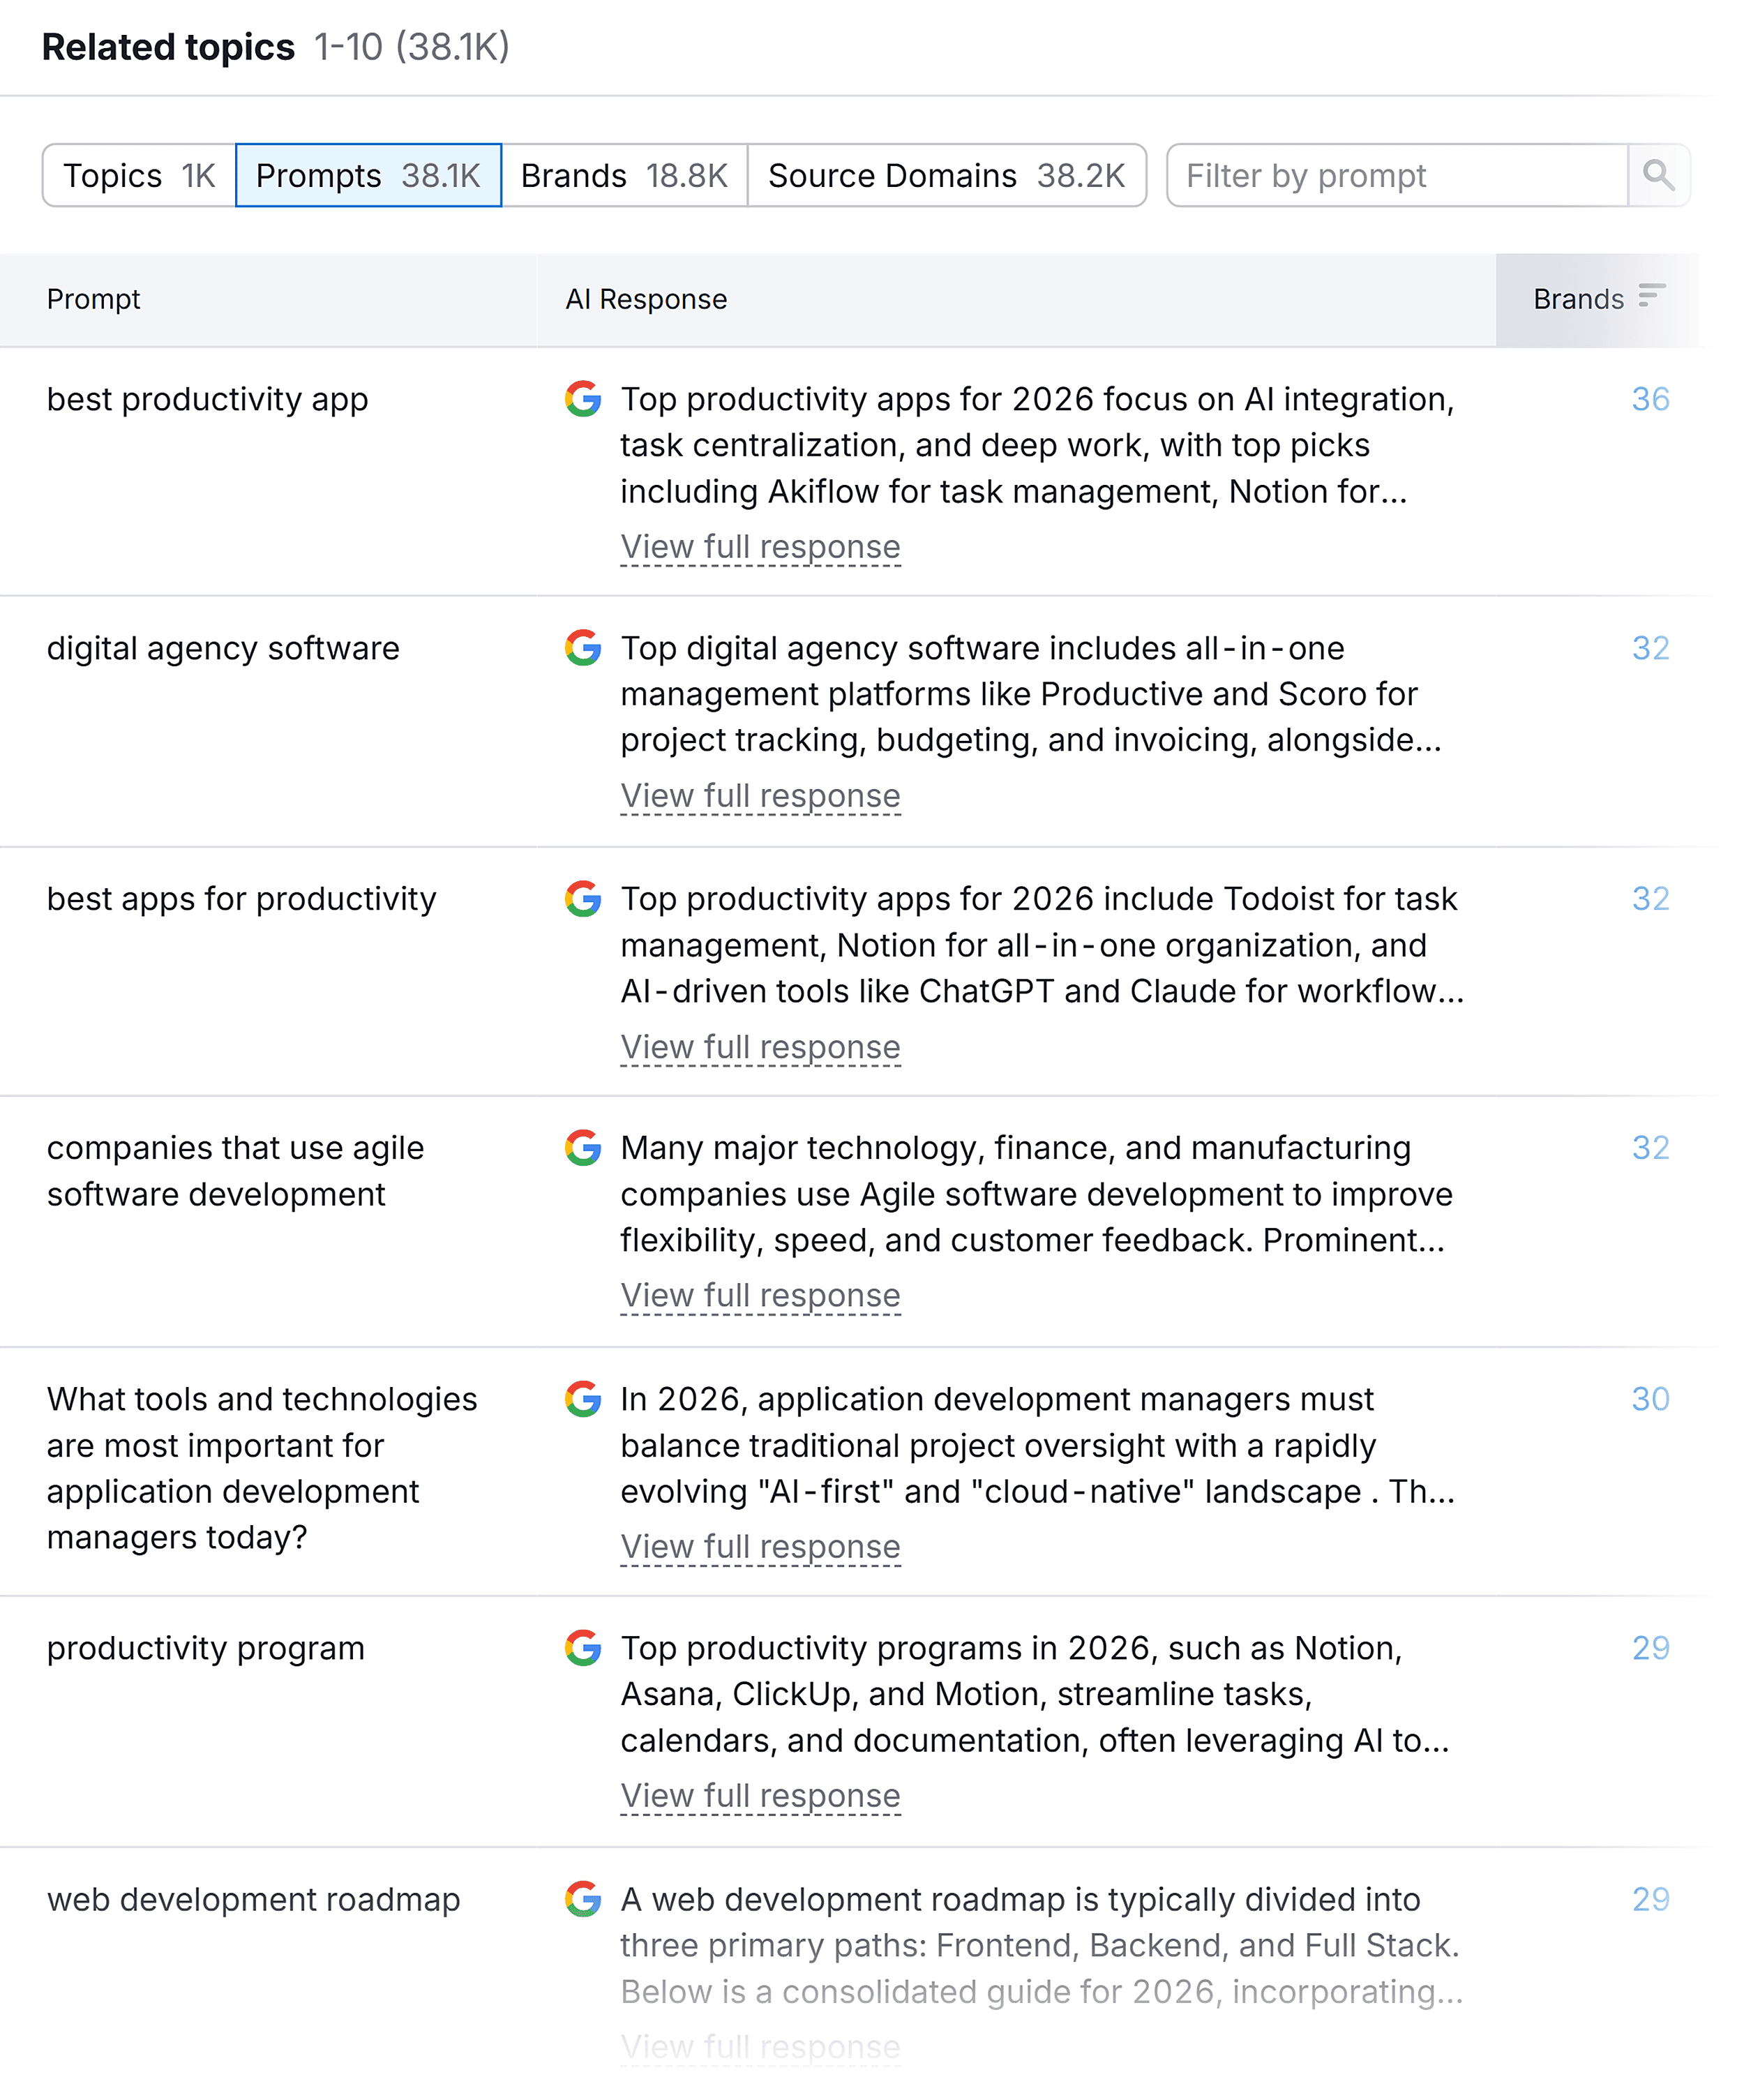
Cultivating an AI Prompt Library: Given the conversational nature of AI search, prompts often mirror natural language used in community discussions. Browsing platforms like Reddit, Facebook groups, and Slack communities for discussions related to the product category provides rich insights into user pain points and phrasing. For example, a Reddit discussion about "user-friendly project management tools for small creative agencies" can directly inspire an AI prompt like "What’s the most intuitive project management tool for small creative agencies?" For decision-stage prompts, review sites like G2 and Capterra offer ready-made comparisons (e.g., "[Your Brand] vs. [Competitor]" or "alternatives to [Competitor]"), which are highly likely to be used as AI queries. Advanced tools like Semrush’s AI Visibility Toolkit can further assist by identifying prompts where competitors are mentioned in AI answers but the brand is not, revealing significant content gaps.
Documenting Metadata: All collected keywords and prompts must be organized into a master spreadsheet. Essential metadata includes the keyword/prompt itself, its associated topic cluster, buyer funnel stage, estimated search volume (for SEO keywords), and search intent. This structured metadata becomes the strategic lens through which SoV data is analyzed, informing decisions on content prioritization and resource allocation.
Step 3: Calculating Share of Voice
With the industry landscape defined and libraries built, the next step is the actual calculation of SoV for both organic and AI search.
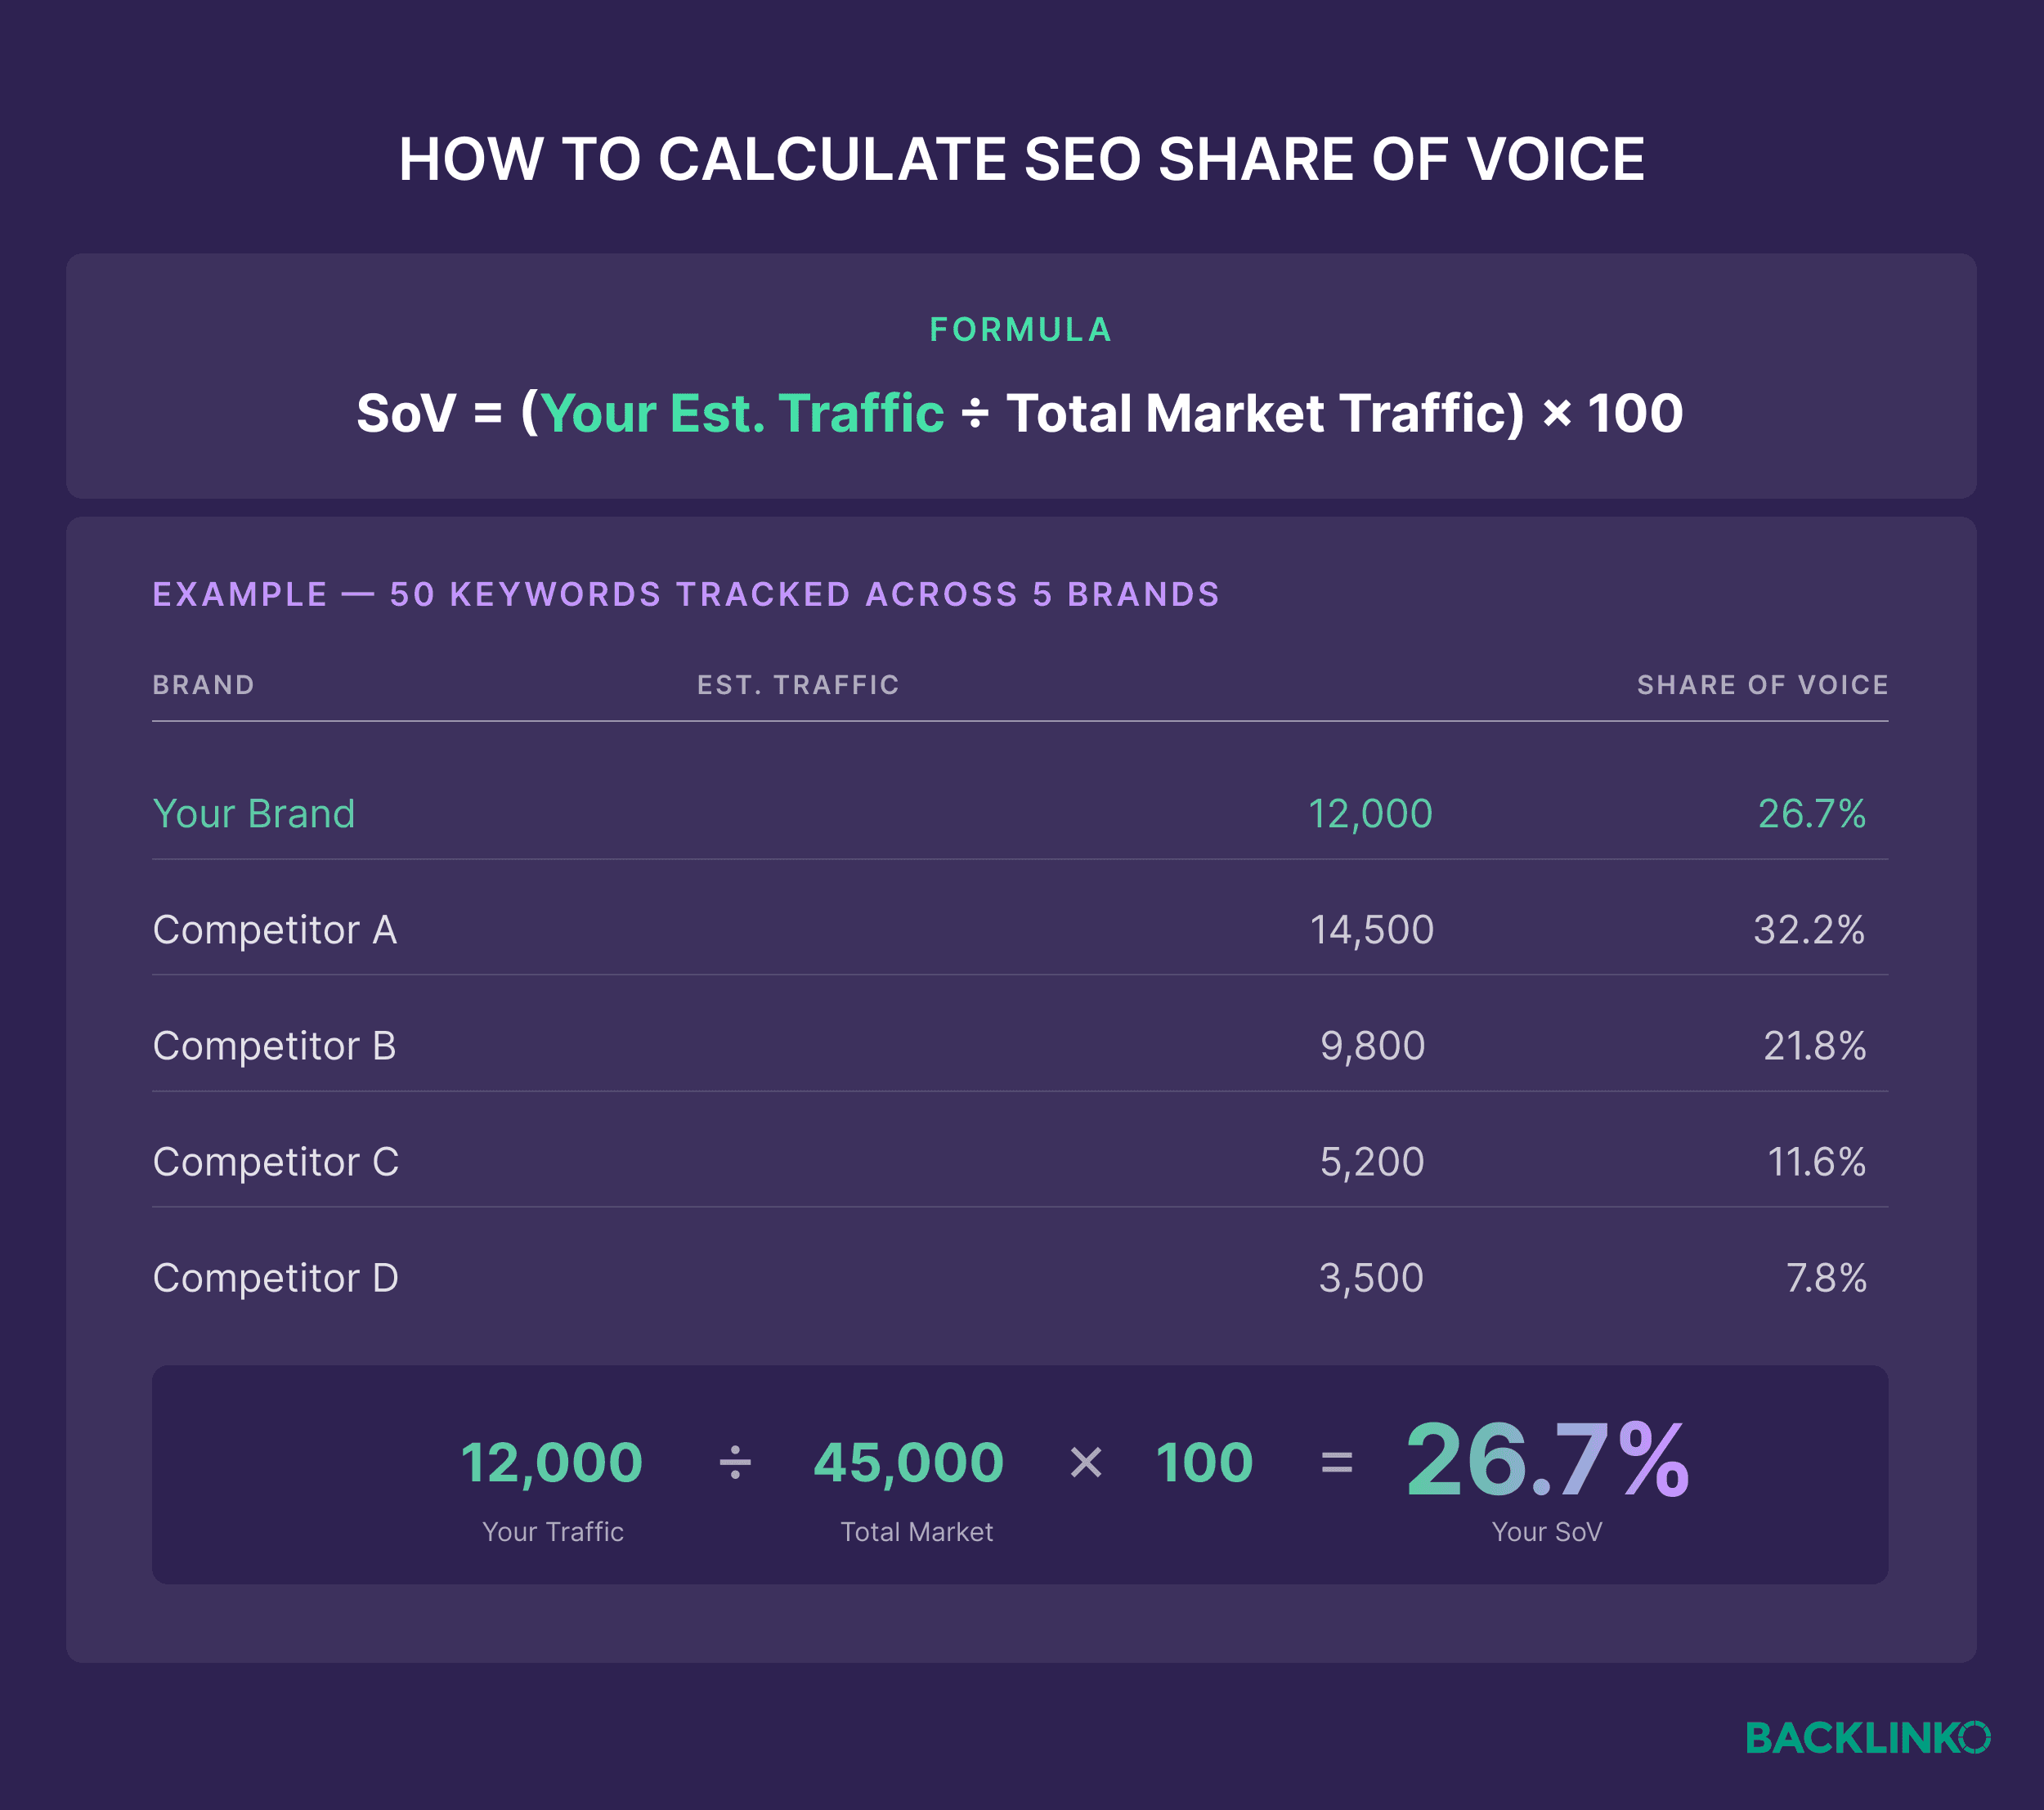
Calculating SEO Share of Voice: This involves tracking rankings for all keywords in the library, for both the brand and its identified competitors. Each ranking position is then assigned an estimated click-through rate (CTR), with industry data suggesting the first organic result typically captures around 27% of clicks. The estimated traffic for each keyword is calculated by multiplying its monthly search volume by the CTR for the brand’s (or competitor’s) ranking position. Summing these estimated traffic figures across all keywords for each brand allows for the calculation of SEO SoV: (Your Estimated Traffic / Total Estimated Traffic for All Tracked Brands) * 100.

While manual calculation is possible, tools like Semrush Position Tracking automate this complex process, continuously collecting daily ranking data and aggregating it into SoV percentages for multiple domains. It is crucial to configure location settings accurately, as search results and thus SoV can vary significantly by geographic region.
Calculating AI Share of Voice: Measuring AI SoV quantifies how often LLMs reference a brand when responding to category-related queries. While a manual, directional measurement can be performed by systematically testing prompts across various AI platforms (e.g., ChatGPT, Google AI Mode, Perplexity) and counting brand mentions/citations, this method quickly becomes unscalable. Specialized tools like Semrush’s AI Visibility Toolkit offer automated solutions. By inputting a brand’s domain, the toolkit analyzes hundreds of relevant prompts, evaluating AI responses for brand mentions, direct citations, and the sentiment associated with those mentions (positive, neutral, negative). This data is then aggregated to calculate a brand’s AI SoV, providing insights into platform-specific visibility gaps and the qualitative nature of AI mentions. The tool also provides insights into "key business drivers," showing which topics are most frequently associated with a brand and its competitors in AI responses.
Interpreting SEO vs. AI Share of Voice: A crucial analytical step is comparing SEO SoV and AI SoV, as these metrics may not always align. A brand might dominate organic search rankings but have a weak AI SoV if its content isn’t deemed authoritative or citable by LLMs. Conversely, a brand with highly credible, well-structured content might achieve a strong AI SoV even without top organic rankings. A strategic matrix helps guide actions:
- High SEO SoV, High AI SoV: A dominant position in both traditional and AI search. Focus on maintaining content freshness, expanding into adjacent topics, and defending market share.
- High SEO SoV, Low AI SoV: Strong organic rankings, but low AI citation. Prioritize optimizing content for AI readability (e.g., content chunking, clear summaries), and developing citable assets that LLMs value for authority.
- Low SEO SoV, High AI SoV: AI tools cite the brand despite poor organic rankings. This indicates strong content quality but weak SEO fundamentals. Focus on improving technical SEO, internal linking, site speed, and keyword optimization to leverage existing content authority.
- Low SEO SoV, Low AI SoV: A significant visibility challenge. The recommendation is to focus on depth over breadth, creating definitive, well-researched pillar content for core topic clusters to build foundational visibility in both search types.
Step 4: Establishing a Baseline and Tracking Trends
The final step transforms raw SoV numbers into an ongoing, decision-making system. A baseline dashboard should be created, providing three layers of detail: overall SoV, SoV by topic cluster, and SoV by buyer funnel stage. This dashboard serves as a continuous monitoring tool.
Strategic tracking cadence is crucial; monthly monitoring allows for the identification of trends without overreacting to daily fluctuations. Quarterly deep dives are recommended to:
- Identify significant shifts in competitive SoV.
- Assess the impact of recent content or marketing initiatives.
- Re-evaluate topic clusters and competitor sets.
- Refine the overall SoV strategy based on evolving market dynamics.
This systematic approach prevents chasing short-term variations and ensures focus on critical, long-term shifts that impact market position and revenue.
Strategies for Improving Share of Voice
Fluctuations in SoV do not all warrant the same response. A strategic diagnosis is essential to prioritize actions that will genuinely move the revenue needle.
1. Closing Visibility Gaps: Clusters with consistently low SoV (e.g., below 10%) indicate near invisibility in critical areas, particularly damaging for decision-stage queries. If a brand has minimal visibility for "best project management software," it simply isn’t making the consideration cut. Opportunities also exist in areas where competitors dominate but a brand has a strong, unique offering. For a project management tool serving creative agencies, zero visibility for "project management for creative teams" represents a prime opening.
- Potential Solutions:
- Topical Authority Building: Develop comprehensive pillar pages supported by multiple, interlinked articles covering all facets of a topic cluster. Invest in high-quality backlinks to these pillar pages to enhance authority and visibility across all related queries.
- Decision-Stage Content: Prioritize the creation of direct comparison pages (e.g., "[Your Brand] vs. [Competitor]") and detailed buyer’s guides that address specific decision-stage criteria.
2. Solving Efficiency Problems: A high SoV that does not translate into business outcomes signals an efficiency problem. For example, dominating the "what is project management" awareness-stage cluster might yield high SoV, but if only 1% of that traffic converts, resources are likely misallocated. This means the brand is winning visibility for the wrong audience, while competitors capture high-intent buyers.
- Potential Solutions:
- Resource Reallocation: Shift marketing budgets and content creation efforts from low-intent awareness content to bottom-of-funnel assets, such as detailed product comparison guides, customer case studies, and ROI calculators, targeting buyers closer to conversion.
- Content Optimization: Update existing comparison pages with fresh data, competitive intelligence, and clear calls to action to improve conversion rates.
3. Addressing Competitive Threats: Continuous monitoring of competitors is paramount. If a rival gains more than 5% SoV in a brand’s traditionally strong clusters, it’s an early warning sign of a direct challenge to market share. Ignoring such shifts can lead to a widening gap and erosion of leadership.
- Potential Solutions:
- Review Site Optimization: Proactively manage and optimize profiles on industry review sites (e.g., G2, Capterra). Implement campaigns to encourage satisfied customers to leave positive reviews, directly influencing AI responses and buyer trust.
- Community Engagement: Actively participate in relevant online communities (Reddit, Slack, LinkedIn groups) where target audiences discuss solutions. Provide valuable insights and subtle brand mentions to organically increase visibility and authority.
Prioritizing Based on Effort vs. Impact: Not all identified gaps or opportunities hold equal weight. The most effective strategy involves prioritizing initiatives based on a clear assessment of effort versus potential impact on the revenue pipeline.
- High Impact, Low Effort: These are often quick wins that can deliver significant returns. Examples include optimizing existing high-ranking content for AI snippets, refreshing old comparison pages, or running targeted review campaigns.
- High Impact, High Effort: These initiatives require substantial investment but offer compounding long-term benefits. This category includes building comprehensive topical authority around core clusters, developing advanced AI-optimized content strategies, or launching major PR campaigns to influence AI narratives.
- Low Impact, Low Effort & Low Impact, High Effort: These should generally be deprioritized, as they divert resources from more impactful activities.
Making SoV the 2026 North Star Metric
In an increasingly complex and fragmented digital landscape, where AI plays an ever-growing role in buyer discovery, Share of Voice emerges as an indispensable metric. It offers the unparalleled ability to capture how often a brand appears across the diverse platforms where purchasing decisions are truly made. By systematically measuring current SoV across both organic and AI search, identifying critical visibility gaps, and strategically addressing competitive threats, brands can not only maintain relevance but also achieve sustainable market leadership. Embracing SoV as a core KPI fosters internal alignment, optimizes resource allocation, and ultimately drives tangible business growth in the evolving digital frontier.


