Mastering Twitter Analytics on X: Comprehensive Guide to Metrics, Access, and Strategy

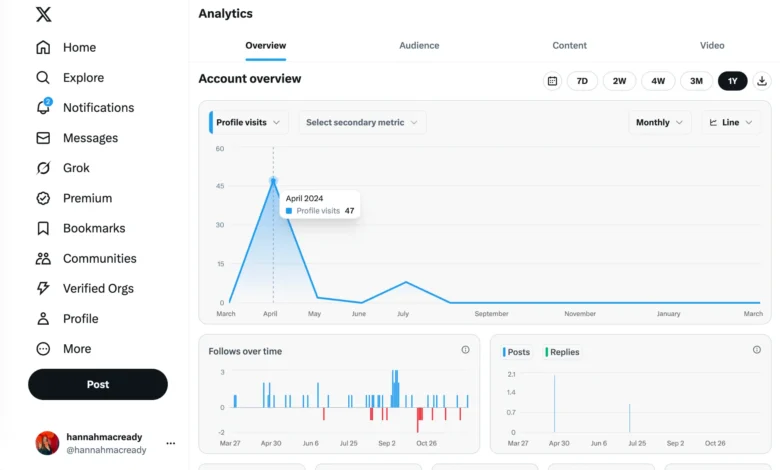
The landscape of social media measurement has undergone a profound structural shift, forcing digital marketers, enterprise brands, and independent creators to rethink how they evaluate performance on the platform formerly known as Twitter. Since the platform transitioned under Elon Musk’s ownership and rebranded to X, native reporting functionalities have fractured. The comprehensive desktop dashboard that once provided free, centralized account-level reporting for all users is now largely restricted to X Premium subscribers and verified accounts. Consequently, navigating X analytics requires a sophisticated understanding of platform tiers, alternative third-party tools, and the specific metrics that actually drive meaningful return on investment in a modern digital marketing ecosystem.

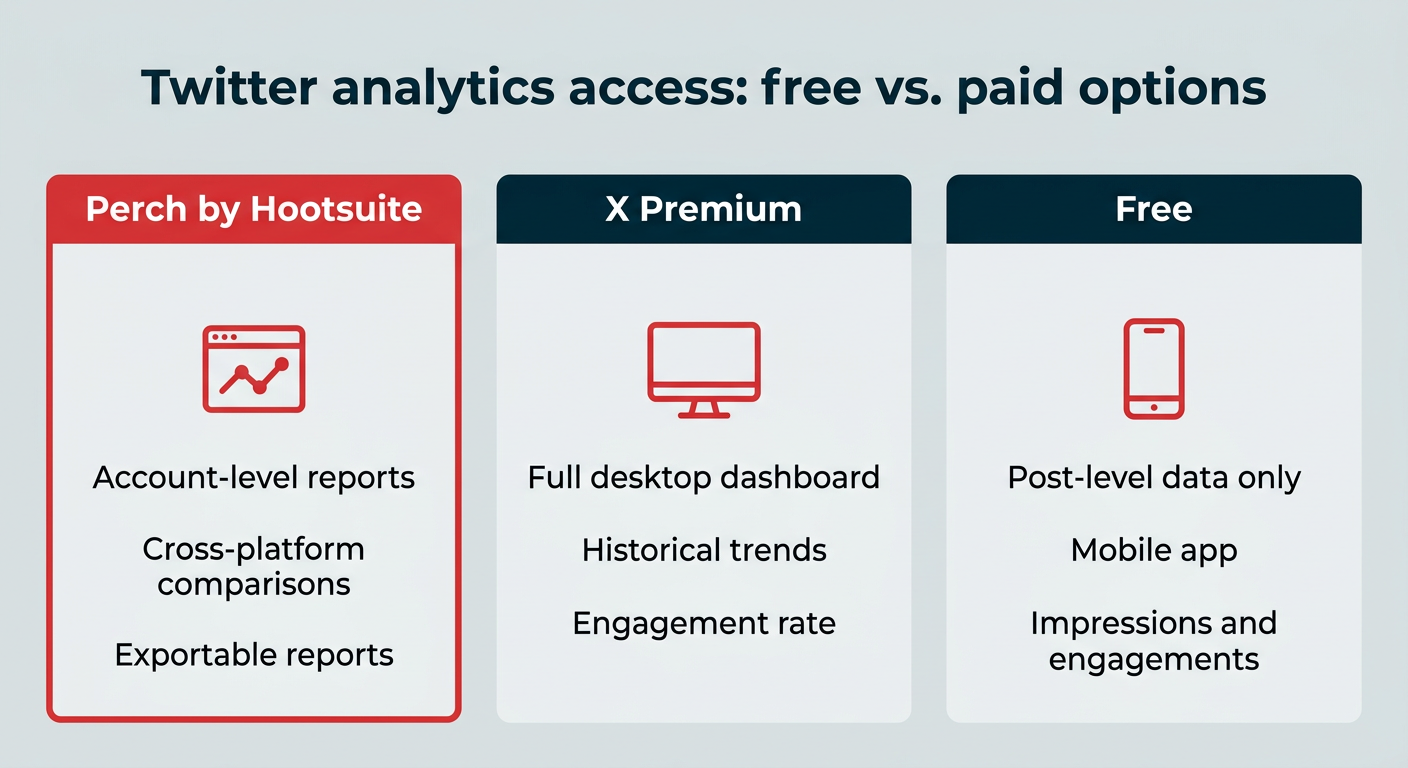
Understanding the current state of X analytics demands a clear breakdown of accessibility. While the overarching desktop reporting suite—which aggregates follower growth, broad impressions, and macro-level engagement trends—now sits behind a paid subscription wall utilized by millions of accounts globally, a foundational layer of data remains accessible without financial investment. Users operating on free tiers can still evaluate granular, post-level performance metrics directly through the mobile application by accessing individual post parameters. Furthermore, enterprise-grade and mid-market organizations increasingly rely on integrated social media management suites such as Hootsuite’s Perch, Buffer, and Later to aggregate performance data, bypass native paywalls, and synthesize cross-platform analytics into unified dashboards.
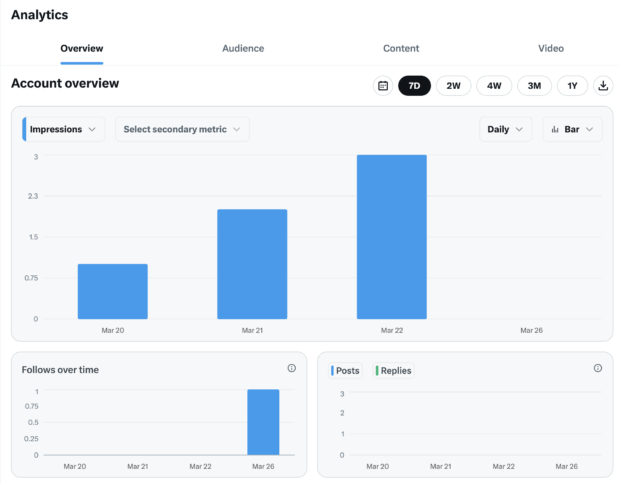
The division in data access has established a bifurcated environment for digital strategists. Free mobile analytics grant immediate visibility into individual post metrics—including basic impressions, likes, replies, and profile clicks—allowing content creators to gauge immediate reception. However, strategic planning at scale requires the longitudinal data traditionally found in the central dashboard or advanced third-party suites. According to digital marketing analysts, this paywall strategy aligns with X’s broader commercial objectives to monetize its infrastructure while incentivizing creator subscriptions through revenue-sharing programs. These ad revenue-sharing initiatives, which distribute earnings based on ads displayed within reply threads rather than raw view counts, have further complicated how creators evaluate platform value, separating vanity metrics from true commercial viability.
To construct an effective marketing strategy on X, professionals must align their tracking methodologies with specific organizational goals rather than attempting to monitor every data point available. Industry standards dictate that key performance indicators (KPIs) should be categorized by objective: brand awareness, community engagement, website traffic generation, and brand perception.
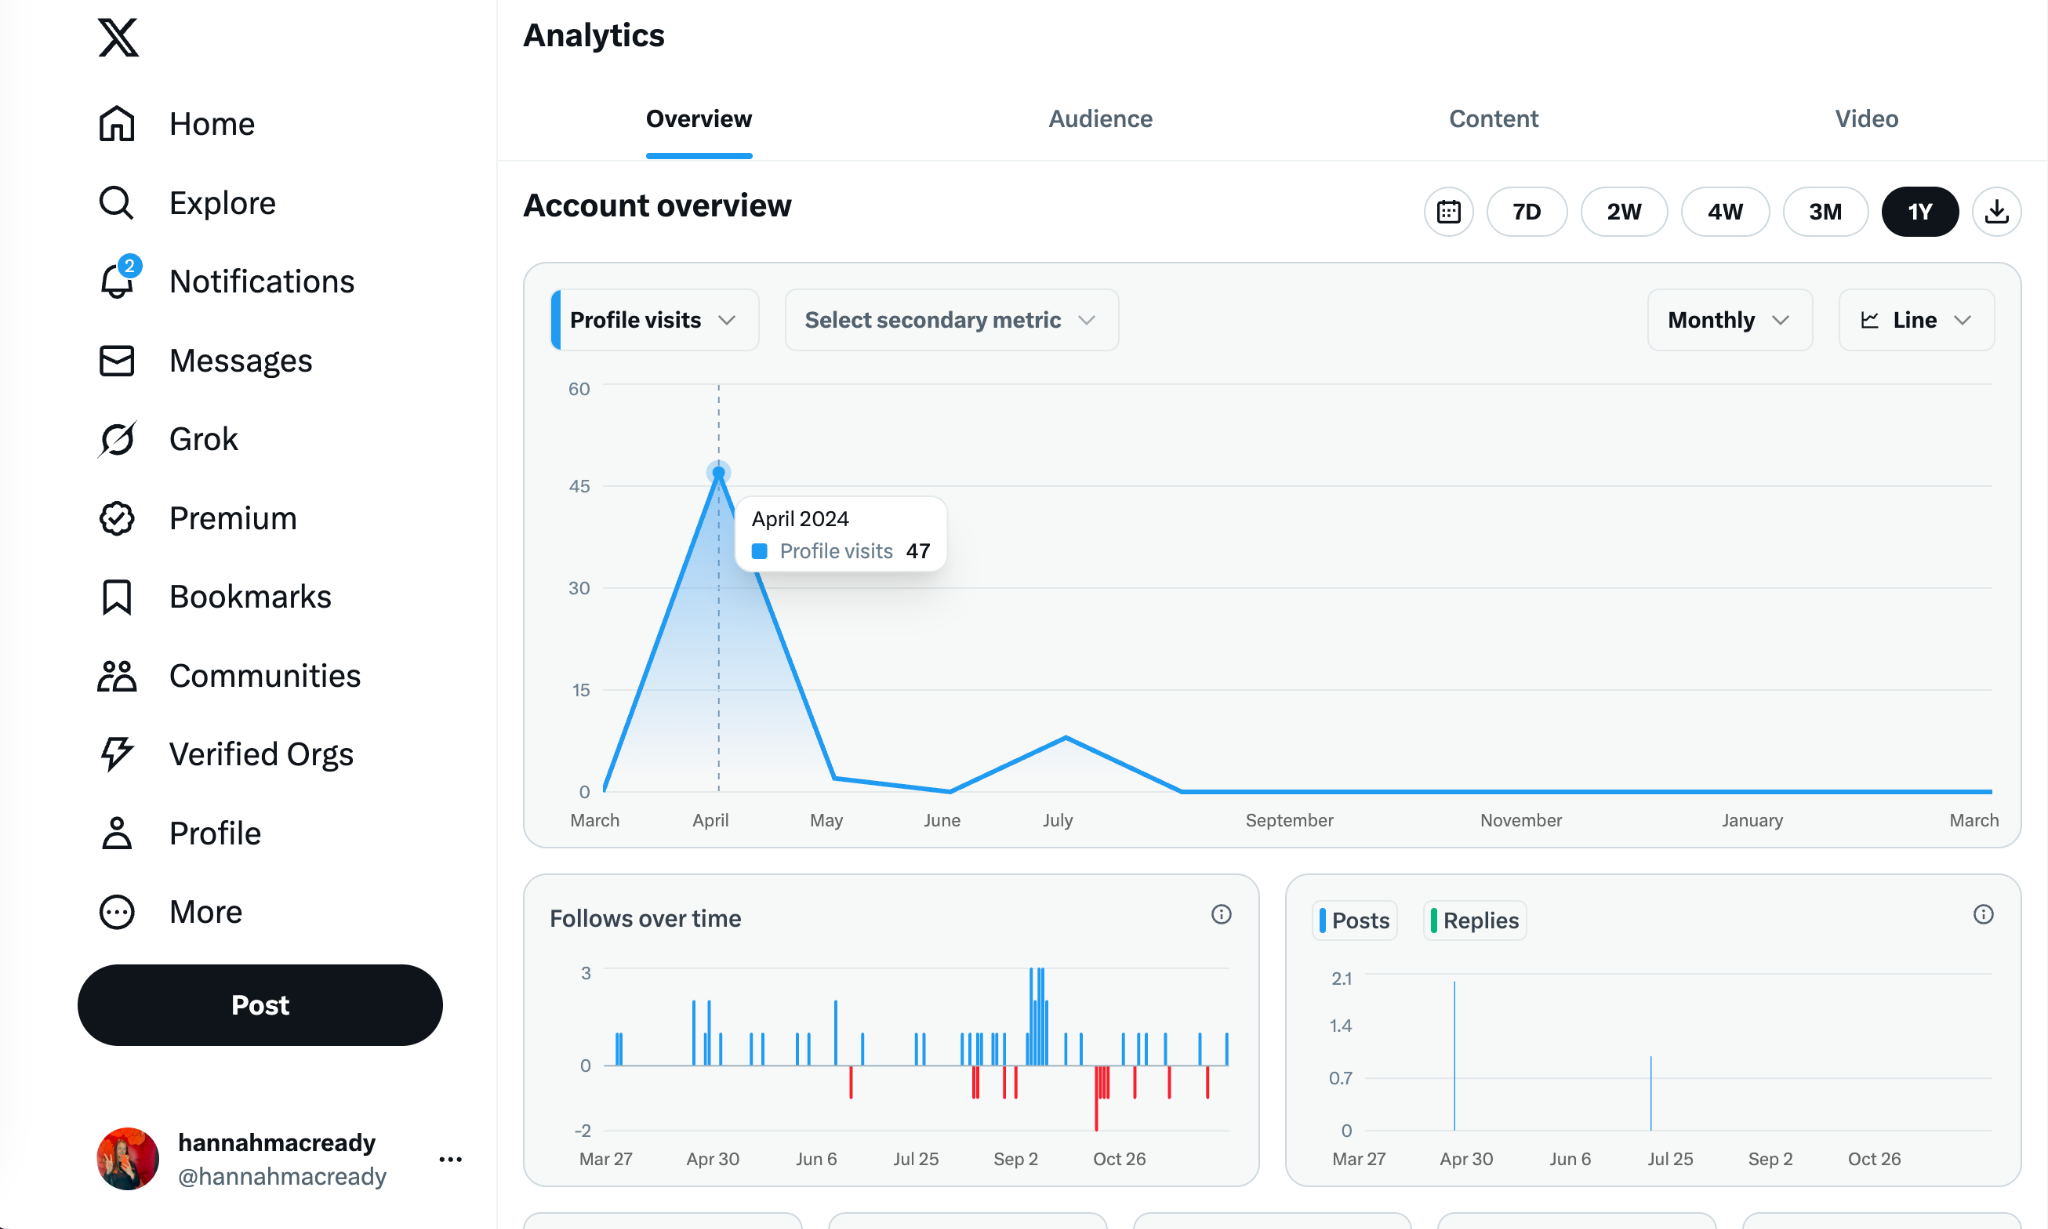
For awareness campaigns, tracking unique reach and impressions remains vital, though professionals must distinguish between the two. Impressions count the total number of times content appears on a screen, whereas unique reach measures the actual number of individual accounts that viewed the post. Contextualizing these metrics against broader digital trends—such as the gradual year-over-year decline in average organic impressions noted across major social platforms—allows marketing teams to evaluate true algorithmic visibility rather than seasonal fluctuations.

Engagement metrics serve as the primary indicator of content resonance. The standard engagement rate is calculated by dividing total interactions—including likes, replies, reposts, link clicks, and profile expansions—by total impressions, multiplying the result by 100. A high engagement rate signals to the platform’s recommendation algorithm that content is sparking conversation, thereby expanding organic distribution. Conversely, low engagement rates often point toward ineffective hooks, misaligned messaging, or suboptimal timing. Industry benchmarks suggest that while raw likes offer a superficial nod of approval, metrics such as replies and reposts hold significantly higher value for community building and expanding audience reach into secondary networks.

Industry experts emphasize that isolated metrics provide limited value without comparative baselines. Nick Martin, Social Media Marketing Manager at Tipalti, notes that successful social strategy relies on balancing microscopic post-level adjustments with macroscopic quarterly evaluations. "I zoom out to see how our profile is performing on a weekly, monthly, and quarterly basis," Martin explains, highlighting the importance of iterative experimentation regarding post length, visual assets, and threading structures. By establishing internal benchmarks—such as calculating a baseline impression and click-through rate based on historical account data—marketing teams can rapidly identify anomalous performance spikes or slumps, separating repeatable strategies from temporary anomalies.

Moreover, modern digital strategy requires leveraging competitive intelligence and cross-departmental insights. Because direct analytics of rival accounts are proprietary, brands increasingly utilize social listening frameworks and private monitoring lists to observe competitor content performance, audience sentiment, and emerging discourse. Distributing these insights beyond the social media department—sharing consumer feedback with product development, competitive data with sales teams, and high-performing creative formats with design units—transforms social analytics from a localized marketing metric into an enterprise-wide intelligence asset.

As the digital marketing sector looks toward advanced reporting solutions, selecting the appropriate analytical tool depends heavily on organizational scale and budget constraints. Enterprise organizations frequently deploy comprehensive platforms like Perch by Hootsuite to manage cross-platform benchmarking, custom reporting, and automated URL shorteners that track customer journeys seamlessly into web analytics software. Meanwhile, smaller teams and solo creators often gravitate toward streamlined applications such as Buffer or Later for rapid access to core post metrics and optimal posting time recommendations. Ultimately, regardless of the tool employed, the foundational principle of X analytics remains unchanged: data is only as valuable as the strategic actions it informs. Organizations that successfully map their X metrics directly to business outcomes—moving past surface-level impressions to measure conversions, traffic, and brand equity—will continue to extract maximum value from the platform’s evolving ecosystem.